This is the full developer documentation for xrelia docs
# xrelia docs
> Everything you need to monitor, understand, and improve the health of your applications and infrastructure.
## Go to the next level
Dive deeper into xrelia documentation and explore all the capabilities it gives you

### Core concepts
15 Articles
* [xrelia model](/docs/core-concepts/xrelia-model)
* [Health scoring](/docs/core-concepts/health-scoring)
* [Event model](/docs/core-concepts/event-model)
[View all docs](/docs/core-concepts/overview)

### Console guide
18 Articles
* [Dashboard](/docs/console-guide/dashboard)
* [System setup](/docs/console-guide/system-setup/system-setup-summary)
* [Incidents](/docs/console-guide/incidents)
[View all docs](/docs/console-guide/overview)

### API and SDK
8 Articles
* [API overview](/docs/api/overview)
* [SDK and instrumentation overview](/docs/sdk-and-instrumentation/overview)
* [xrelia agent](/docs/sdk-and-instrumentation/xrelia-agent/overview)
[View all docs](/docs/sdk-and-instrumentation/overview)
# 404
> Page not found. Check the URL or try using the search bar.
# API overview
> An overview of all the configuration options Starlight supports.
The xrelia API allows you to send custom reliability data directly to xrelia. Using the API, you can submit metrics, synthetic request results, dependency health information, and deployment or configuration changes that contribute to your platform’s overall health and reliability analysis.
All API endpoints are versioned and currently use the **v1** API.
***
## Authentication
[Section titled “Authentication”](#authentication)
Before using the API, you must generate an API key from the xrelia console.
Each API key consists of two parts:
* **API key ID** (for example: `apk-5dfb88dc43fd53a2`)
* **API key value** (a secret value generated by xrelia)
Authentication is performed using the `X-API-Key` request header.
To generate the value for this header:
1. Concatenate the API key ID and API key value.
2. Generate a SHA256 hash of the resulting string.
3. Concatenate the API key ID **without the `apk-` prefix** and the generated hash.
4. Supply the result as the value of the `X-API-Key` header.
### Example
[Section titled “Example”](#example)
API key ID:
```text
apk-5dfb88dc43fd53a2
```
API key value:
```text
9afsNDU1Zyt7KrK2OpCTrjaAHLJTUvMMBinq4tuFfrjiNVhUehHCGRd5CWpEI7Nd
```
Concatenated value:
```text
apk-5dfb88dc43fd53a29afsNDU1Zyt7KrK2OpCTrjaAHLJTUvMMBinq4tuFfrjiNVhUehHCGRd5CWpEI7Nd
```
Header value:
```text
5dfb88dc43fd53a2 + SHA256(concatenated value)
```
The final string should be supplied as the value of the `X-API-Key` header for every API request.
***
## API endpoints
[Section titled “API endpoints”](#api-endpoints)
xrelia currently provides four ingestion endpoints.
| Endpoint | Purpose |
| ------------------ | ------------------------------------------------- |
| `/v1/metrics` | Submit custom metrics |
| `/v1/user-journey` | Submit synthetic request and user journey results |
| `/v1/dependencies` | Submit dependency health information |
| `/v1/changes` | Submit deployment and configuration changes |
Base URLs:
```text
https://api.xrelia.com/v1/metrics
https://api.xrelia.com/v1/user-journey
https://api.xrelia.com/v1/dependencies
https://api.xrelia.com/v1/changes
```
Detailed request and response specifications for each endpoint are available in the corresponding API reference pages.
***
## Request format
[Section titled “Request format”](#request-format)
All API requests use the following conventions:
* HTTP method: `POST`
* Content type: `application/json`
* Request body: JSON object
* Authentication: `X-API-Key` header
Every request must include:
* `platformId`
* `instanceId`
These identifiers can be obtained from the xrelia console and determine where incoming data is associated within your xrelia environment.
### Example request
[Section titled “Example request”](#example-request)
```json
{
"platformId": "PLATFORM_ID",
"instanceId": "INSTANCE_ID",
"samples": [
{
"id": "mtr-7e67f568763dacc1",
"ts": 1785513412,
"val": 58.17422866821289
},
{
"id": "mtr-682a6ed20af12b4b",
"ts": 1785513412,
"val": 3.5928143716714303
}
]
}
```
The exact payload structure varies depending on the endpoint being used.
***
## Responses
[Section titled “Responses”](#responses)
xrelia uses standard HTTP status codes to indicate the outcome of a request.
| Status | Meaning |
| ------------------ | ------------------------------------------------ |
| `200 OK` | Request completed successfully |
| `207 Multi-Status` | Request partially succeeded and partially failed |
| `4xx` | Client-side error |
| `5xx` | Server-side error |
When a request fails, xrelia returns a descriptive error message explaining the reason for the failure.
For partial success scenarios, xrelia returns an HTTP `207 Multi-Status` response together with details describing which operations succeeded and which failed.
***
## Next steps
[Section titled “Next steps”](#next-steps)
* Learn how to submit [custom metrics](/docs/api/reference/system-metrics)
* Send synthetic request and [user journey](/docs/api/reference/user-journey) results
* Track [dependency](/docs/api/reference/dependencies) health
* Record deployments and configuration changes
Each endpoint has its own dedicated reference page containing payload definitions, examples, validation rules, and response details.
# Dependencies API
> An overview of all the configuration options Starlight supports.
Send dependency health check results to xrelia to monitor the availability and latency of services that your service instance depends on.
Dependency health checks can be used to monitor external APIs, databases, third-party services, or other systems that are critical to your application’s operation.
## Endpoint
[Section titled “Endpoint”](#endpoint)
```text
POST https://api.xrelia.com/v1/dependencies
```
The request must include a valid `X-API-Key` header. See [Authentication section](/docs/api/overview#authentication) for details.
## Request body
[Section titled “Request body”](#request-body)
The request body must be a JSON object containing the target platform, service instance, and one or more dependency health check results.
```json
{
"platformId": "PLATFORM_ID",
"instanceId": "INSTANCE_ID",
"checkResults": [
{
"id": "DEPENDENCY_HEALTH_CHECK_ID",
"ts": 1785513412,
"sts": 0,
"ms": 280
},
{
"id": "DEPENDENCY_HEALTH_CHECK_ID",
"ts": 1785513412,
"sts": 100,
"ms": 400
}
]
}
```
### Request fields
[Section titled “Request fields”](#request-fields)
| Field | Type | Required | Description |
| -------------------- | ------- | -------- | -------------------------------------------------------------------------------------------------------------------------------- |
| `platformId` | string | Yes | ID of the platform receiving the health check results. Obtain this from the xrelia console. |
| `instanceId` | string | Yes | ID of the service instance associated with the dependency. Obtain this from the xrelia console. |
| `checkResults` | array | Yes | Collection of dependency health check results to submit. |
| `checkResults[].id` | string | Yes | ID of the dependency health check. Obtain this ID from the xrelia console. |
| `checkResults[].ts` | integer | Yes | Unix timestamp indicating when the dependency health check was performed. |
| `checkResults[].sts` | integer | Yes | Dependency status. `0` means the dependency is down and `100` means it is up. |
| `checkResults[].ms` | number | No | Dependency response latency in milliseconds. Can be omitted when the dependency is down and no latency measurement is available. |
### Dependency health check ID
[Section titled “Dependency health check ID”](#dependency-health-check-id)
Each dependency health check configured in xrelia has a unique ID. The ID identifies which dependency the result belongs to.
Use the ID assigned to the dependency health check in the xrelia console when submitting results.
### Timestamp
[Section titled “Timestamp”](#timestamp)
The `ts` field specifies when the dependency check was performed, rather than when the result was submitted to xrelia.
The value must be a Unix timestamp expressed in seconds.
For example:
```text
1785513412
```
### Status
[Section titled “Status”](#status)
The `sts` field indicates whether the dependency was available when the check was performed.
xrelia currently supports a binary dependency status:
| Value | Meaning |
| ----- | ------------------ |
| `0` | Dependency is down |
| `100` | Dependency is up |
Intermediate status values are not currently supported.
### Latency
[Section titled “Latency”](#latency)
The optional `ms` field contains the dependency response time in milliseconds.
For an available dependency, include the measured latency whenever possible:
```json
{
"id": "DEPENDENCY_HEALTH_CHECK_ID",
"ts": 1785513412,
"sts": 100,
"ms": 400
}
```
When the dependency is down and no meaningful latency measurement is available, `ms` can be omitted:
```json
{
"id": "DEPENDENCY_HEALTH_CHECK_ID",
"ts": 1785513412,
"sts": 0
}
```
## Response
[Section titled “Response”](#response)
A successful request returns:
```text
200 OK
```
If the request cannot be processed, xrelia returns an appropriate HTTP error status together with a descriptive error message.
A `207 Multi-Status` response is returned when a request is only partially successful—for example, when some dependency health check results are accepted while others fail validation.
See [API Overview](/docs/api/overview#responses) for general response and error handling.
## Example
[Section titled “Example”](#example)
```bash
curl -X POST "https://api.xrelia.com/v1/dependencies" \
-H "Content-Type: application/json" \
-H "X-API-Key: YOUR_API_KEY" \
-d '{
"platformId": "PLATFORM_ID",
"instanceId": "INSTANCE_ID",
"checkResults": [
{
"id": "DATABASE_HEALTH_CHECK_ID",
"ts": 1785513412,
"sts": 100,
"ms": 28
},
{
"id": "PAYMENT_API_HEALTH_CHECK_ID",
"ts": 1785513412,
"sts": 0
}
]
}'
```
Dependency health results become part of the service instance’s reliability data, allowing xrelia to incorporate dependency availability and latency into its overall health and confidence analysis.
# Metrics API
> An overview of all the configuration options Starlight supports.
Send metric samples to xrelia for analysis and monitoring. Metric samples can represent infrastructure, application, or custom metrics configured for a service instance.
## Endpoint
[Section titled “Endpoint”](#endpoint)
```text
POST https://api.xrelia.com/v1/metrics
```
The request must include a valid `X-API-Key` header. See [Authentication section](/docs/api/overview#authentication) for details.
## Request body
[Section titled “Request body”](#request-body)
The request body must be a JSON object containing the target platform, service instance, and one or more metric samples.
```json
{
"platformId": "PLATFORM_ID",
"instanceId": "INSTANCE_ID",
"samples": [
{
"id": "METRIC_ID",
"ts": 1785513412,
"val": 58.17422866821289
},
{
"id": "METRIC_ID",
"ts": 1785513412,
"val": 3.5928143716714303
}
]
}
```
### Request fields
[Section titled “Request fields”](#request-fields)
| Field | Type | Required | Description |
| --------------- | ------- | -------- | --------------------------------------------------------------------------------------------------- |
| `platformId` | string | Yes | ID of the Platform receiving the metric samples. Obtain this from the xrelia console. |
| `instanceId` | string | Yes | ID of the Service Instance receiving the metric samples. Obtain this from the xrelia console. |
| `samples` | array | Yes | Collection of metric samples to submit. |
| `samples[].id` | string | Yes | Unique ID of the metric. Metric IDs are assigned in the xrelia console when metrics are configured. |
| `samples[].ts` | integer | Yes | Unix timestamp indicating when the metric sample was collected. |
| `samples[].val` | number | Yes | Numeric value of the metric at the specified timestamp. |
### Metric IDs
[Section titled “Metric IDs”](#metric-ids)
Every metric configured in xrelia has a unique Metric ID. For example, a service instance may have separate metrics for CPU utilization, memory usage, system load, and network activity.
Use the Metric ID assigned to the metric in the xrelia console when submitting samples.
### Timestamp
[Section titled “Timestamp”](#timestamp)
The `ts` field specifies when the measurement was collected, rather than when it was submitted to xrelia.
The value must be a Unix timestamp expressed in seconds.
For example:
```text
1785513412
```
### Value
[Section titled “Value”](#value)
The `val` field contains the measured value of the metric.
The value is numeric and can be an integer or floating-point number. The expected unit and interpretation depend on how the metric is configured in the xrelia console.
## Response
[Section titled “Response”](#response)
A successful request returns:
```text
200 OK
```
If the request cannot be processed, xrelia returns an appropriate HTTP error status together with a descriptive error message.
A `207 Multi-Status` response is returned when a request is only partially successful—for example, when some submitted samples are accepted while others fail validation.
See [API Overview](/docs/api/overview#responses) for general response and error handling.
## Example
[Section titled “Example”](#example)
```bash
curl -X POST "https://api.xrelia.com/v1/metrics" \
-H "Content-Type: application/json" \
-H "X-API-Key: YOUR_API_KEY" \
-d '{
"platformId": "PLATFORM_ID",
"instanceId": "INSTANCE_ID",
"samples": [
{
"id": "CPU_METRIC_ID",
"ts": 1785513412,
"val": 58.17
}
]
}'
```
Metric samples submitted through this endpoint become part of the service instance’s reliability data and can contribute to xrelia’s health and confidence analysis.
# User journey API
> An overview of all the configuration options Starlight supports.
Send synthetic request results to xrelia to monitor the availability and performance of critical user journeys and application workflows.
Synthetic requests allow you to verify that your application is working from a user’s perspective, rather than only checking whether individual services are available.
## Endpoint
[Section titled “Endpoint”](#endpoint)
```text
POST https://api.xrelia.com/v1/user-journey
```
The request must include a valid `X-API-Key` header. See [Authentication section](/docs/api/overview#authentication) for details.
## Request
[Section titled “Request”](#request)
The request body must be a JSON object containing the target platform, service instance, and one or more synthetic request results.
```json
{
"platformId": "PLATFORM_ID",
"instanceId": "INSTANCE_ID",
"syntheticRequestResults": [
{
"id": "SYNTHETIC_REQUEST_ID",
"ts": 1785513412,
"sts": 0,
"ms": 280
},
{
"id": "SYNTHETIC_REQUEST_ID",
"ts": 1785513412,
"sts": 100,
"ms": 320
}
]
}
```
### Request fields
[Section titled “Request fields”](#request-fields)
| Field | Type | Required | Description |
| ------------------------------- | ------- | -------- | -------------------------------------------------------------------------------------------------------------- |
| `platformId` | string | Yes | ID of the Platform receiving the synthetic request results. Obtain this from the xrelia console. |
| `instanceId` | string | Yes | ID of the Service Instance associated with the user journey. Obtain this from the xrelia console. |
| `syntheticRequestResults` | array | Yes | Collection of synthetic request results to submit. |
| `syntheticRequestResults[].id` | string | Yes | ID of the synthetic request. Obtain this ID from the xrelia console. |
| `syntheticRequestResults[].ts` | integer | Yes | Unix timestamp indicating when the synthetic request was performed. |
| `syntheticRequestResults[].sts` | integer | Yes | Request status. `0` means the request failed and `100` means it succeeded. |
| `syntheticRequestResults[].ms` | number | No | Request latency in milliseconds. Can be omitted when the request fails and no meaningful latency is available. |
### Synthetic Request ID
[Section titled “Synthetic Request ID”](#synthetic-request-id)
Each synthetic request configured in xrelia has a unique ID. The ID identifies the specific step or operation being monitored.
Use the ID assigned to the synthetic request in the xrelia console when submitting results.
### Timestamp
[Section titled “Timestamp”](#timestamp)
The `ts` field specifies when the synthetic request was performed, rather than when the result was submitted to xrelia.
The value must be a Unix timestamp expressed in seconds.
For example:
```text
1785513412
```
### Status
[Section titled “Status”](#status)
The `sts` field indicates whether the synthetic request succeeded.
xrelia currently uses a binary status model:
| Value | Meaning |
| ----- | ----------------- |
| `0` | Request failed |
| `100` | Request succeeded |
Intermediate status values are not currently supported.
### Latency
[Section titled “Latency”](#latency)
The optional `ms` field contains the synthetic request response time in milliseconds.
For a successful request, include the measured latency whenever possible:
```json
{
"id": "SYNTHETIC_REQUEST_ID",
"ts": 1785513412,
"sts": 100,
"ms": 320
}
```
When the request fails and no meaningful latency measurement is available, `ms` can be omitted:
```json
{
"id": "SYNTHETIC_REQUEST_ID",
"ts": 1785513412,
"sts": 0
}
```
## Response
[Section titled “Response”](#response)
A successful request returns:
```text
200 OK
```
If the request cannot be processed, xrelia returns an appropriate HTTP error status together with a descriptive error message.
A `207 Multi-Status` response is returned when a request is only partially successful—for example, when some synthetic request results are accepted while others fail validation.
See [API Overview](/docs/api/overview#responses) for general response and error handling.
## Example
[Section titled “Example”](#example)
```bash
curl -X POST "https://api.xrelia.com/v1/user-journey" \
-H "Content-Type: application/json" \
-H "X-API-Key: YOUR_API_KEY" \
-d '{
"platformId": "PLATFORM_ID",
"instanceId": "INSTANCE_ID",
"syntheticRequestResults": [
{
"id": "LOGIN_REQUEST_ID",
"ts": 1785513412,
"sts": 100,
"ms": 245
},
{
"id": "CHECKOUT_REQUEST_ID",
"ts": 1785513412,
"sts": 0
}
]
}'
```
Synthetic request results become part of the service instance’s reliability data, allowing xrelia to evaluate application availability and user-facing performance as part of its overall health and confidence analysis.
# Dashboard
> TBD
The dashboard provides a real-time overview of your platform’s reliability. It brings together active incidents, historical incident activity, overall health, latency, and availability in a single view.
Use the dashboard to quickly understand the current state of your platform and identify areas that require attention.
## A hierarchy of attention
[Section titled “A hierarchy of attention”](#a-hierarchy-of-attention)
xrelia follows a simple UI philosophy: the higher something appears on the screen, the more important or urgent it is. The most critical information, active incidents, service health, and issues requiring immediate attention, is placed at the top, where it can be seen first during a quick scan. As you move down the page, information becomes progressively less urgent and more contextual, helping users move naturally from “What needs my attention now?” to “Why is it happening?” and finally “What else should I know?” This hierarchy allows engineers to understand the state of their platform at a glance without having to search through dashboards to find what matters.
## Incident summary and health cards
[Section titled “Incident summary and health cards”](#incident-summary-and-health-cards)
The summary cards at the top of the dashboard provide an immediate view of incident activity.

### Active incidents
[Section titled “Active incidents”](#active-incidents)
Shows the number of incidents currently affecting your platform.
The number below the count indicates how many services are currently affected by these incidents.
### Decaying incidents
[Section titled “Decaying incidents”](#decaying-incidents)
Shows incidents that are no longer actively worsening and are moving toward recovery.
This can help distinguish ongoing problems from incidents whose impact is decreasing.
### 24-hr incidents
[Section titled “24-hr incidents”](#24-hr-incidents)
Shows the number of incidents detected during the last 24 hours and the number of services affected by them.
### 72-hr incidents
[Section titled “72-hr incidents”](#72-hr-incidents)
Shows the number of incidents detected during the last 72 hours and the number of services affected.
Together, these incident indicators provide a quick view of both current and recent reliability activity.
### Health cards
[Section titled “Health cards”](#health-cards)
The health cards show the overall health of the platform across different time windows.
xrelia currently provides:
* **5-min health** - short-term platform health
* **1-hr health** - recent platform health over the last hour
* **24-hr health** - longer-term platform health over the last 24 hours
Each health card displays a health state and its corresponding health score.
A score provides a numeric representation of platform health, while the health state makes the result easier to interpret at a glance.
***
## Overall health
[Section titled “Overall health”](#overall-health)
The **1-hr overall health** chart shows how the platform’s health has evolved during the selected time period.
The chart can display:
* **Health** - overall health score
* **Critical impact** - impact associated with critical incidents
* **Major impact** - impact associated with major incidents
* **Minor impact** - impact associated with minor incidents
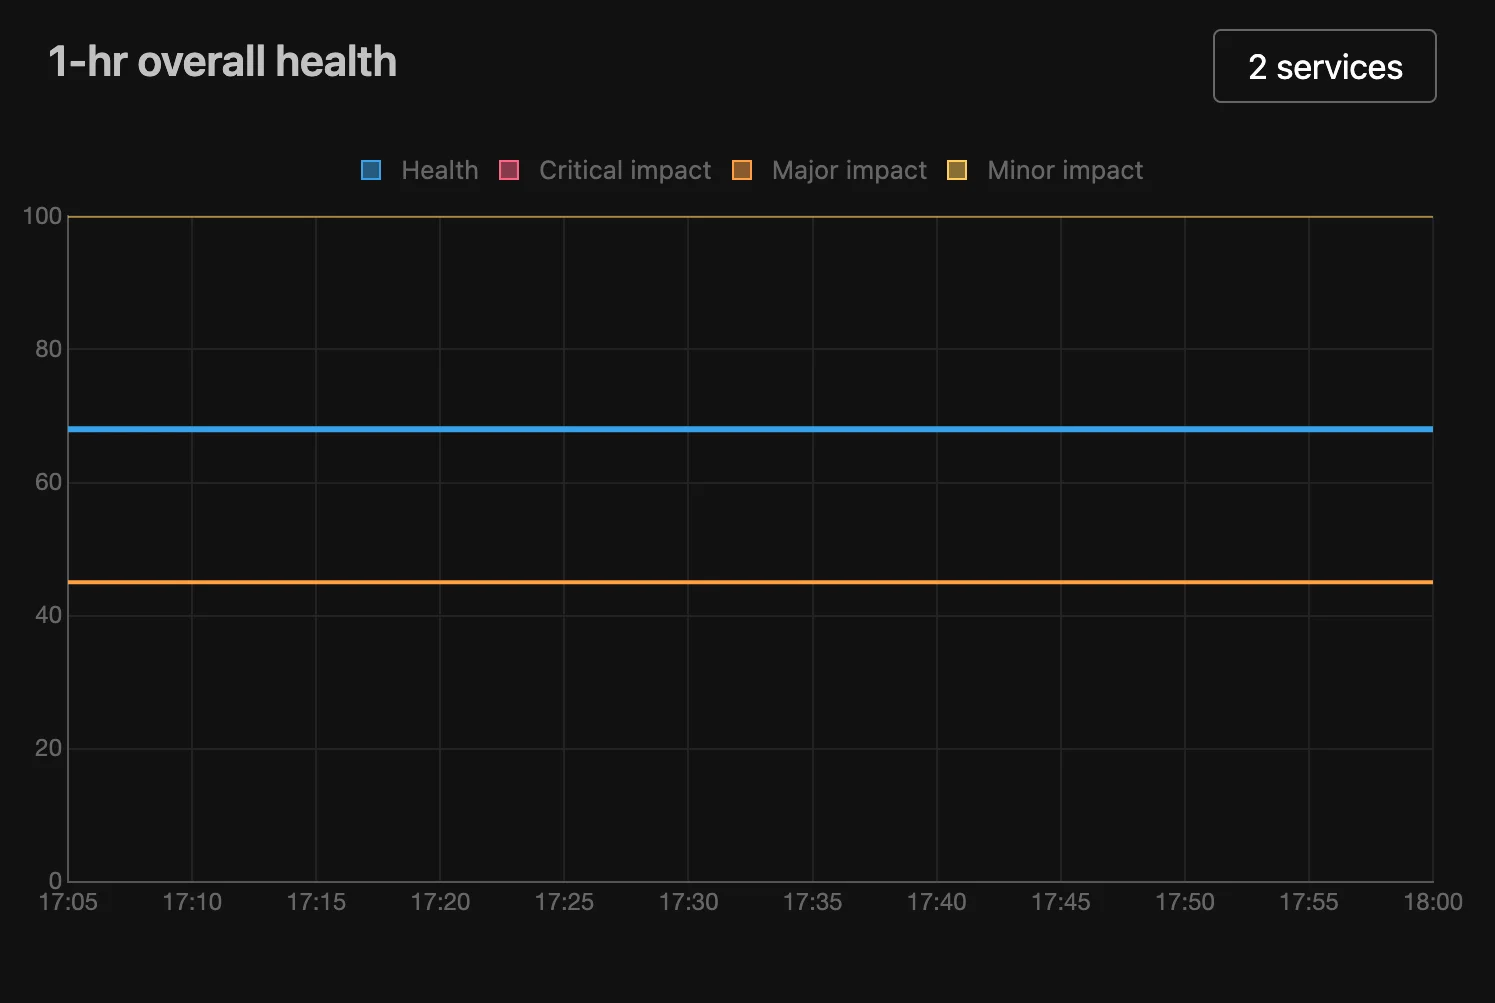
Use this chart to understand whether platform health is stable, improving, or deteriorating and how incidents are contributing to the overall health picture.
The service count displayed above the chart indicates how many services are included in the current health calculation.
***
## Latency
[Section titled “Latency”](#latency)
The dashboard provides latency charts for the **P50**, **P90**, and **P99** percentiles for each service.
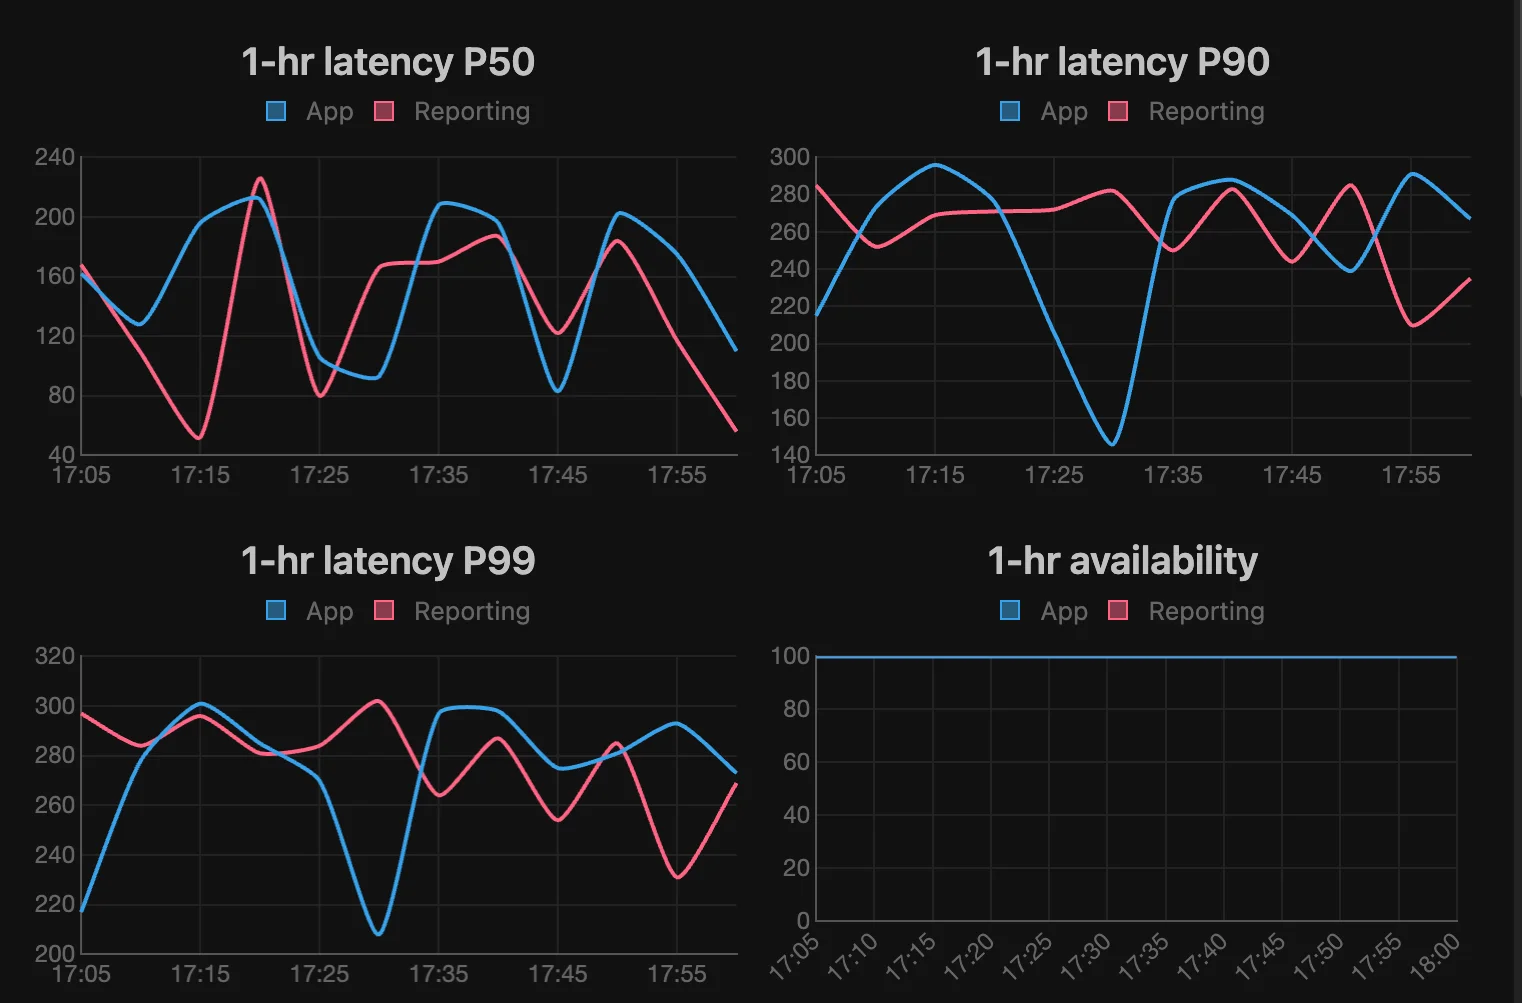
xrelia allows you to choose which monitoring source is used to calculate latency:
* Health checks - latency measured by service health checks.
* User journeys - latency measured by synthetic requests that simulate real user interactions or application workflows.
This allows you to view latency from either a service-level perspective or from the perspective of actual application workflows.
### P50
[Section titled “P50”](#p50)
P50 represents the median latency. Half of the measured requests complete faster than this value and half take longer.
### P90
[Section titled “P90”](#p90)
P90 represents the latency below which 90% of requests complete. It provides a better view of slower requests than the median.
### P99
[Section titled “P99”](#p99)
P99 represents the latency below which 99% of requests complete. It is particularly useful for identifying high-latency outliers that may affect a smaller portion of users.
Latency charts can show data for individual services, allowing you to compare their performance over time.
### Availability
[Section titled “Availability”](#availability)
The **1-hr availability** chart shows the availability of the services included in the current view.
Availability is expressed as a percentage, making it easy to identify periods where a service experienced failures or degraded availability.
Use availability together with latency and health information to distinguish between a service that is unavailable and one that is available but performing poorly.
***
## Reading the Dashboard
[Section titled “Reading the Dashboard”](#reading-the-dashboard)
The dashboard is designed to support a simple workflow:
1. **Check the incident summary** to see whether anything is currently affecting the platform.
2. **Check the health cards** to understand the current and recent reliability state.
3. **Review overall health** to see how platform health has changed over time.
4. **Inspect latency** to identify performance degradation and high-latency outliers.
5. **Check availability** to determine whether services are experiencing failures.
This combination gives you a unified view of platform reliability without requiring you to inspect individual monitoring signals separately.
# Incidents
> TBD
**Schrödinger’s section:** This section both exists and doesn’t. Check back later.
# Overview
> TBD
**Schrödinger’s section:** This section both exists and doesn’t. Check back later.
# Dependencies
> Learn how to create and organize new documentation pages in your Dockit site.
**Schrödinger’s section:** This section both exists and doesn’t. Check back later.
# Health checks
> Learn how to create and organize new documentation pages in your Dockit site.
**Schrödinger’s section:** This section both exists and doesn’t. Check back later.
# Instances
> Learn how to create and organize new documentation pages in your Dockit site.
**Schrödinger’s section:** This section both exists and doesn’t. Check back later.
# Metrics
> Learn how to create and organize new documentation pages in your Dockit site.
**Schrödinger’s section:** This section both exists and doesn’t. Check back later.
# Services
> TBD
**Schrödinger’s section:** This section both exists and doesn’t. Check back later.
# System setup summary
> Learn how to create and organize new documentation pages in your Dockit site.
**Schrödinger’s section:** This section both exists and doesn’t. Check back later.
# User journey
> Learn how to create and organize new documentation pages in your Dockit site.
**Schrödinger’s section:** This section both exists and doesn’t. Check back later.
# Event model
> TBD
Every observation in xrelia is represented as an event. Health checks, synthetic requests, metrics, dependency updates, changes, and incidents all follow a unified event model.
This allows xrelia to correlate signals across services and platforms, detect patterns, and build a complete operational timeline.
## Unified event taxonomy
[Section titled “Unified event taxonomy”](#unified-event-taxonomy)
All monitoring data is classified into a small set of event types.
The primary event categories are health check events, synthetic request events, metric events, dependency events, change events and incident events.
Using a consistent taxonomy makes it possible to correlate infrastructure, application, and user experience signals within a single platform.
## Event lifecycle
[Section titled “Event lifecycle”](#event-lifecycle)
An event progresses through a lifecycle from creation to archival.
Events are ingested, validated, normalized, correlated with related events, and stored for analysis. Incidents may be created or updated as new events arrive.
This lifecycle ensures that raw monitoring data becomes actionable operational intelligence.
## Correlation
[Section titled “Correlation”](#correlation)
Correlation connects events that are likely related to the same operational problem.
For example, a database latency spike, API health check failures, and checkout synthetic request failures may all be linked to a single database incident.
Correlation reduces noise and helps identify root causes more quickly.
## Deduplication
[Section titled “Deduplication”](#deduplication)
Deduplication prevents repeated observations from creating unnecessary alerts or incidents.
Multiple identical failures within a short period are grouped together, allowing operators to focus on meaningful changes rather than repetitive events.
This significantly reduces alert fatigue during ongoing outages.
## Incident clustering
[Section titled “Incident clustering”](#incident-clustering)
Incident clustering groups related events across services and dependencies into a single incident.
Instead of creating separate incidents for every failing health check, xrelia identifies the underlying disruption and creates a unified incident with affected services, dependencies, and timelines.
Clustering provides a clearer operational picture and simplifies incident response.
# Health scoring
> TBD
xrelia continuously evaluates the health of every service instance using health checks, synthetic requests, metrics, and dependencies These signals are combined into a health assessment that reflects both the current operational state and the confidence of that assessment.
Health is calculated at the service instance level and then aggregated upward:
Service Instance → Service → Platform
This hierarchy allows xrelia to detect localized failures while still providing a clear view of overall service and platform health.
## Service instance health
[Section titled “Service instance health”](#service-instance-health)
Each service instance receives a health score based on the current state of its health checks, synthetic requests, metrics, and dependencies.
Health is not binary. An instance may be fully healthy, degraded, partially unavailable, or unavailable.
Service instance health is the primary operational signal used for alerting, incident creation, and service health aggregation.
## Service health
[Section titled “Service health”](#service-health)
Service health represents the combined health of all instances belonging to the same service.
A service with multiple instances may remain healthy even if one instance fails, depending on the severity and the proportion of affected instances.
Service health provides a logical application-level view that abstracts away individual deployment details.
## Platform health
[Section titled “Platform health”](#platform-health)
Platform health represents the overall operational state of a platform, such as production or staging.
xrelia aggregates the health of all services within a platform and weighs them by service importance. A critical production service has a greater impact on platform health than a non-critical internal tool.
Platform health provides a high-level view of whether an entire deployment environment is functioning normally.
## Confidence score
[Section titled “Confidence score”](#confidence-score)
The Confidence score measures how certain xrelia is about a service’s health assessment.
A service instance with many recent observations from health checks, synthetic requests, and metrics has high confidence. An instance with sparse data, newly created checks, or intermittent reporting has lower confidence.
Recent deployments and configuration changes also influence confidence during incident analysis by increasing the likelihood that a new failure is related to a recent change.
Confidence helps distinguish between “the instance is healthy” and “we do not have enough evidence to know.”
## Latency percentiles
[Section titled “Latency percentiles”](#latency-percentiles)
Latency is evaluated using percentile distributions rather than simple averages.
xrelia tracks percentiles such as p50, p90, and p99 to capture the full range of response time behavior.
Percentiles provide a more accurate view of user experience and help detect performance degradation before availability is affected.
## Availability calculation
[Section titled “Availability calculation”](#availability-calculation)
Availability is calculated from health check and synthetic request results over rolling time windows.
xrelia measures the percentage of successful observations and tracks uptime across configurable periods. Availability calculations automatically account for failures, timeouts, and missing observations.
Availability is used for health scoring, alerting thresholds, and service-level reporting.
## Observation windows
[Section titled “Observation windows”](#observation-windows)
Health calculations are performed over rolling observation windows.
Short windows provide fast detection of failures, while longer windows provide stability and historical context. xrelia combines multiple windows to balance responsiveness with accuracy.
For example, a brief spike may affect a short-term health score, while a sustained outage will significantly affect both short-term and long-term health.
## Change-aware attribution
[Section titled “Change-aware attribution”](#change-aware-attribution)
Deployments and configuration changes do not directly reduce health scores. Instead, xrelia uses them as contextual signals during incident detection and root cause analysis.
When failures begin shortly after a deployment or configuration change, xrelia automatically associates those events with the change timeline and highlights them as likely contributing factors.
This allows operators to quickly answer not only “Is the service unhealthy?” but also “Did a recent change likely cause it?”
# Core concepts overview
> TBD
xrelia is built around a small set of core concepts that represent the health of your systems. Understanding these concepts will help you model your infrastructure, monitor services effectively, and interpret incidents with confidence.
## The xrelia model
[Section titled “The xrelia model”](#the-xrelia-model)
xrelia organizes reliability intelligence around nine core resources: Platforms, Services, Service instances, Health checks, User journey (synthetic requests), Metrics, Dependencies, Changes, and Incidents.
## Core resources
[Section titled “Core resources”](#core-resources)
| Option | Description |
| --------------- | ---------------------------------------------------------------------- |
| `Platforms` | Production, staging, preview |
| `Services` | Applications and components |
| `Instances` | Specific deployments of a service on a platform |
| `Health checks` | Direct availability probes |
| `User journey` | Synthetic request checks and monitoring |
| `Metrics` | Performance and resource data |
| `Dependencies` | Internal and external relationships |
| `Changes` | Deployment or configuration modifications affecting a service instance |
| `Incidents` | Correlated operational events |
# The xrelia model
> TBD
xrelia organizes reliability intelligence around nine core resources: Platforms, Services, Service Instances, Health Checks, User journey (synthetic requests), Metrics, Dependencies, Changes, and Incidents.
## Platforms
[Section titled “Platforms”](#platforms)
A Platform represents a deployment context such as production, staging, preview, or development.
Platforms allow the same service to exist in multiple environments without mixing operational data. Health, incidents, alerts, and metrics are evaluated independently for each platform.
A service can have one or many service instances within a platform, and platform health is calculated from the health of those instances.
For example, the api service may have multiple production instances across regions and a separate staging instance, each monitored independently.
## Services
[Section titled “Services”](#services)
A Service represents a logical application, API, worker, database, queue, or infrastructure component.
Services provide ownership, organization, and a unified view across multiple deployments. They aggregate health from all associated service instances and are the primary resource used for dashboards, alerting, and incident management.
Use services to represent the systems your team owns.
Typical services include a web API, an authentication service, a PostgreSQL database, a Redis cluster, or a background job processor.
## Instances
[Section titled “Instances”](#instances)
A Service Instance represents a specific deployment of a service on a platform, region, cluster, or infrastructure target.
Service instances are the resources that xrelia actively monitors. Health checks, synthetic requests, metrics, and dependencies are associated with individual instances, allowing xrelia to detect localized failures that may affect only one deployment.
For example, a production deployment in one region can become unhealthy while other instances of the same service remain healthy.
Use service instances to represent what is actually running in production.
## Health checks
[Section titled “Health checks”](#health-checks)
A Health check is a direct probe that verifies whether a service is reachable and responding correctly.
Health checks are the primary signal for availability. They can perform HTTP, HTTPS, TCP, DNS, or custom checks against your services and infrastructure.
A health check records whether the target succeeded, failed, timed out, or returned an unexpected response. xrelia uses these results to calculate availability and confidence.
Use health checks to answer a simple question: Is this service operational right now?
## User journey
[Section titled “User journey”](#user-journey)
Unlike a health check, which verifies basic availability, a User journey validates that critical functionality is working correctly. User journey is a collection of one or more synthetic requests.
A Synthetic Request simulates a real user interaction with your application.
It can perform authenticated requests, multi-step API flows, or complete user journeys.
Synthetic monitoring helps detect issues that infrastructure metrics cannot, such as broken authentication, failed checkout flows, expired certificates, or third-party API failures.
Use synthetic requests to answer: Can users successfully complete important actions?
## Metrics
[Section titled “Metrics”](#metrics)
A Metric is a time-series measurement that describes the behavior or performance of a service.
Metrics can represent latency, request rate, error rate, CPU usage, memory usage, queue depth, database connections, or any custom application measurement.
xrelia stores metrics with timestamps and labels, then calculates aggregations such as averages, percentiles, and rolling windows.
Metrics provide the context needed to understand why a service became unhealthy.
Use metrics to answer: How is the service performing over time?
## Dependencies
[Section titled “Dependencies”](#dependencies)
A Dependency represents a relationship between one service and another system that it relies on.
Dependencies can be internal services, databases, message queues, cloud services, or external APIs. xrelia tracks dependency health separately and incorporates it into service confidence and incident analysis.
When a dependency fails, xrelia can identify which services are affected and estimate the potential blast radius of the failure.
Use dependencies to answer: What could cause this service to fail?
## Changes
[Section titled “Changes”](#changes)
A Change represents a deployment or configuration modification affecting a service instance.
xrelia tracks two types of changes:
Deployment changes, such as new releases, rollouts, restarts, or infrastructure replacements.
Configuration changes, such as environment variable updates, feature flag changes, routing changes, or infrastructure configuration modifications.
Changes are automatically correlated with health checks, synthetic requests, metrics, and incidents. When a service instance becomes unhealthy shortly after a deployment or configuration update, xrelia highlights that change as a likely contributing factor. Use changes to answer: What changed before this problem started?
## Incidents
[Section titled “Incidents”](#incidents)
An Incident is a correlated operational event that represents a meaningful service disruption.
xrelia groups related failures from health checks, synthetic requests, metrics, and dependencies into a single incident. This prevents alert storms and creates a unified operational timeline.
An incident includes severity, affected services, impacted platforms, contributing dependencies, and the sequence of events that led to the disruption.
Use incidents to answer: What is broken, what is affected, and how did it happen?
# How xrelia is different
> An introduction to DocKit and its key features for building beautiful documentation sites.
xrelia is built around service instances, not just services.
Monitoring is attached to the actual runtime deployments that serve traffic, allowing xrelia to detect localized failures, regional degradation, and deployment-specific issues that are often hidden by service-level averages.
More importantly, xrelia treats changes as operational context. When a deployment, restart, or configuration update is followed by failures, xrelia automatically connects those events and surfaces the relationship during incident analysis.
The goal is not only to tell you that something is unhealthy, but also to help you understand why it became unhealthy.
Whether you are monitoring a single application or a distributed platform with hundreds of services, xrelia gives you a clear, context-rich view of system health and operational change.
# Key capabilities
> An introduction to DocKit and its key features for building beautiful documentation sites.
xrelia provides a complete operational view of your systems.
Core capabilities include:
* Unified health monitoring across services and platforms
* Multi-instance service monitoring
* Availability and latency tracking
* Synthetic monitoring for critical user journeys
* Dependency mapping and impact analysis
* Deployment and configuration change tracking
* Automatic incident correlation and clustering
* Health and confidence scoring
* Platform-wide operational visibility
# What is xrelia
> An introduction to DocKit and its key features for building beautiful documentation sites.
xrelia continuously monitors the health of your services across all platforms and deployments.
It combines:
* Health checks for availability
* Synthetic requests for user journey
* Metrics for performance and resource monitoring
* Dependencies for service relationships
* Deployment and configuration changes for operational context
* xrelia automatically correlates these signals to calculate health, confidence, and incident status.
# Why xrelia
> An introduction to DocKit and its key features for building beautiful documentation sites.
Traditional monitoring tools often answer only one question at a time:
* Is the service up?
* Is it slow?
* Is the infrastructure healthy?
* Did a deployment happen?
xrelia answers all of them together.
By correlating monitoring data with dependency relationships and recent changes, xrelia helps you understand what is broken, what is affected, and what likely caused it.
# Next steps
> Next steps...
Congratulations - you’ve completed the **Your first 10 minutes with xrelia** guide. Your first service is now being monitored, health checks are running, and incident notifications are configured.
The next step is to build a more complete monitoring setup and understand how xrelia models your systems.
## Understand the core concepts
[Section titled “Understand the core concepts”](#understand-the-core-concepts)
Before adding more services, take a few minutes to learn [the concepts](/docs/core-concepts/overview) that power xrelia.
Start with:
* **Platforms** - production, staging, preview, and development environments.
* **Services and service instances** - how applications are organized and monitored.
* **Health checks and synthetic requests** - the difference between availability checks and user journey monitoring.
* **Dependencies** - how xrelia maps relationships between services.
* **Incidents and confidence** - how monitoring results are combined into a single operational view.
These concepts will help you design a monitoring structure that scales as your infrastructure grows.
## Expand your monitoring
[Section titled “Expand your monitoring”](#expand-your-monitoring)
Once you’re comfortable with the basics, add more monitoring coverage.
Recommended next steps:
1. **Configure additional health checks** for critical endpoints.
2. **Add synthetic requests** to monitor login flows, checkout flows, APIs, or other user-critical journeys.
3. **Map service dependencies** so incidents can be correlated across your architecture.
4. **Configure notification channels** for your team and define severity thresholds.
## Explore analytics
[Section titled “Explore analytics”](#explore-analytics)
xrelia provides analytics at the service, instance, and platform levels.
Review:
* Availability trends
* Response time percentiles
* Confidence history
* Incident timelines
* Platform health
These views help you understand not just whether a service is down, but how reliability changes over time.
## Manage changes
[Section titled “Manage changes”](#manage-changes)
Monitoring is most useful when it is connected to deployments and configuration changes.
Learn how to:
* Record deployments
* Track configuration changes
* Correlate incidents with recent changes
* Identify regressions after releases
## Build a production setup
[Section titled “Build a production setup”](#build-a-production-setup)
For a production environment, we recommend monitoring every critical service with multiple health checks, synthetic requests for key user journeys, dependency mapping, and notifications routed to the appropriate teams.
A typical setup includes:
* One service for each application or infrastructure component
* Multiple instances across regions or availability zones
* HTTP health checks for availability
* Synthetic requests for user-facing functionality
* Email and push notifications with severity-based routing
## Continue with the documentation
[Section titled “Continue with the documentation”](#continue-with-the-documentation)
A good path through the documentation is:
* [**Core concepts**](/docs/core-concepts/overview)
* [**The Console guide**](/docs/console-guide/overview)
* [**SDK and instrumentation**](/docs/sdk-and-instrumentation/overview)
By the end of these sections, you’ll have a monitoring setup that not only detects outages, but helps you understand impact, identify root causes, and track reliability over time.
# Overview
> TBD
xrelia is a software reliability intelligence platform that helps engineering teams understand the operational state of their applications, infrastructure, and dependencies from a single place.
Instead of treating uptime, performance, user experience, and deployments as separate monitoring problems, xrelia brings them together into a single operational model. Every service, service instance, dependency, metric, health check, synthetic request, and change contributes to a unified view of system health.
The result is faster detection, clearer incident context, and better operational decisions.
# Add a health check
> Configure DocKit's global settings, theme options, and site-wide preferences.
Now that your service instance has been created, add a health check to monitor it.
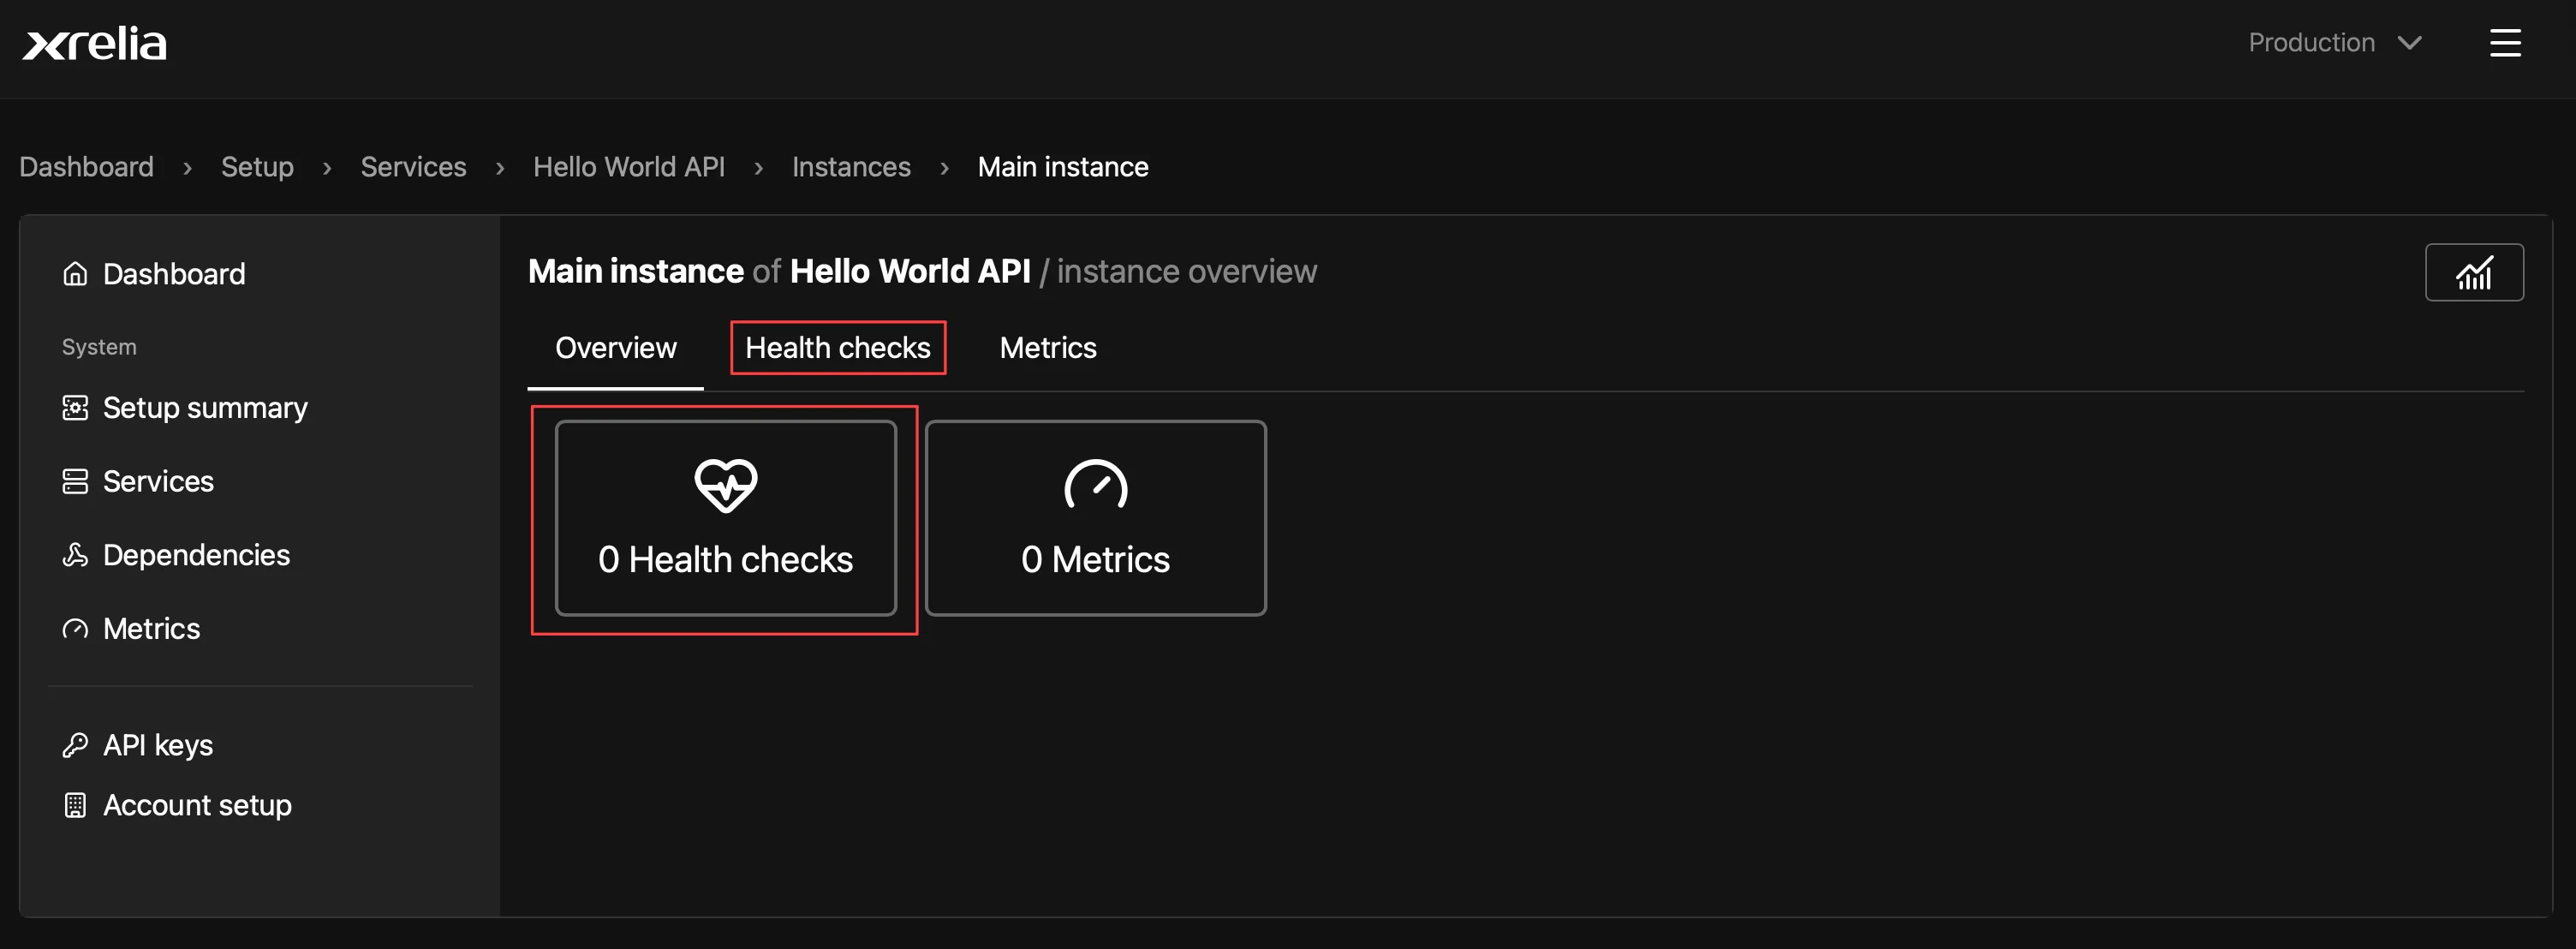
## Open the Health checks tab
[Section titled “Open the Health checks tab”](#open-the-health-checks-tab)
From the Instance overview page, open the Health checks tab or select the Health check tile.
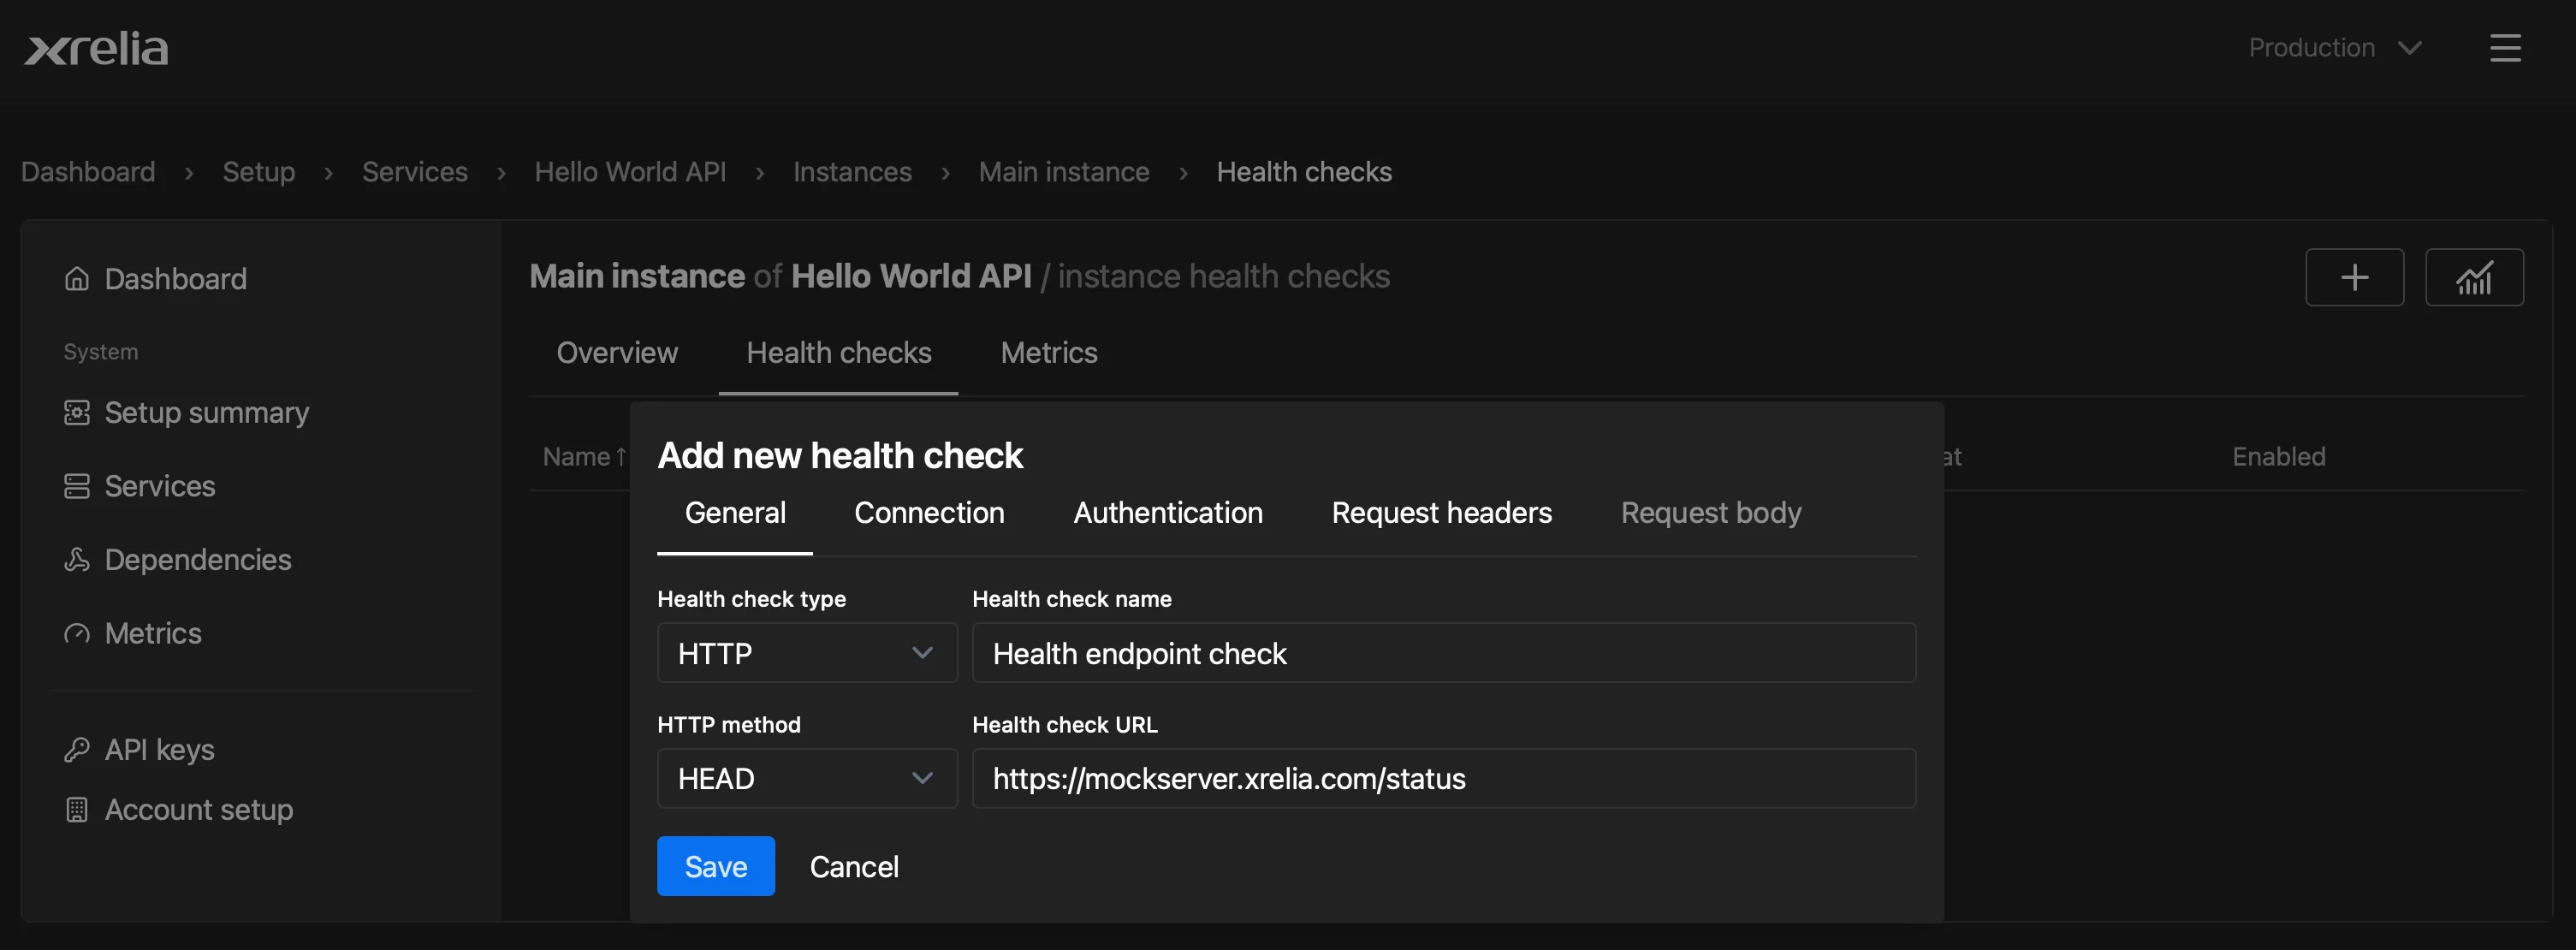
Select the **+** button or **Add new health** check.
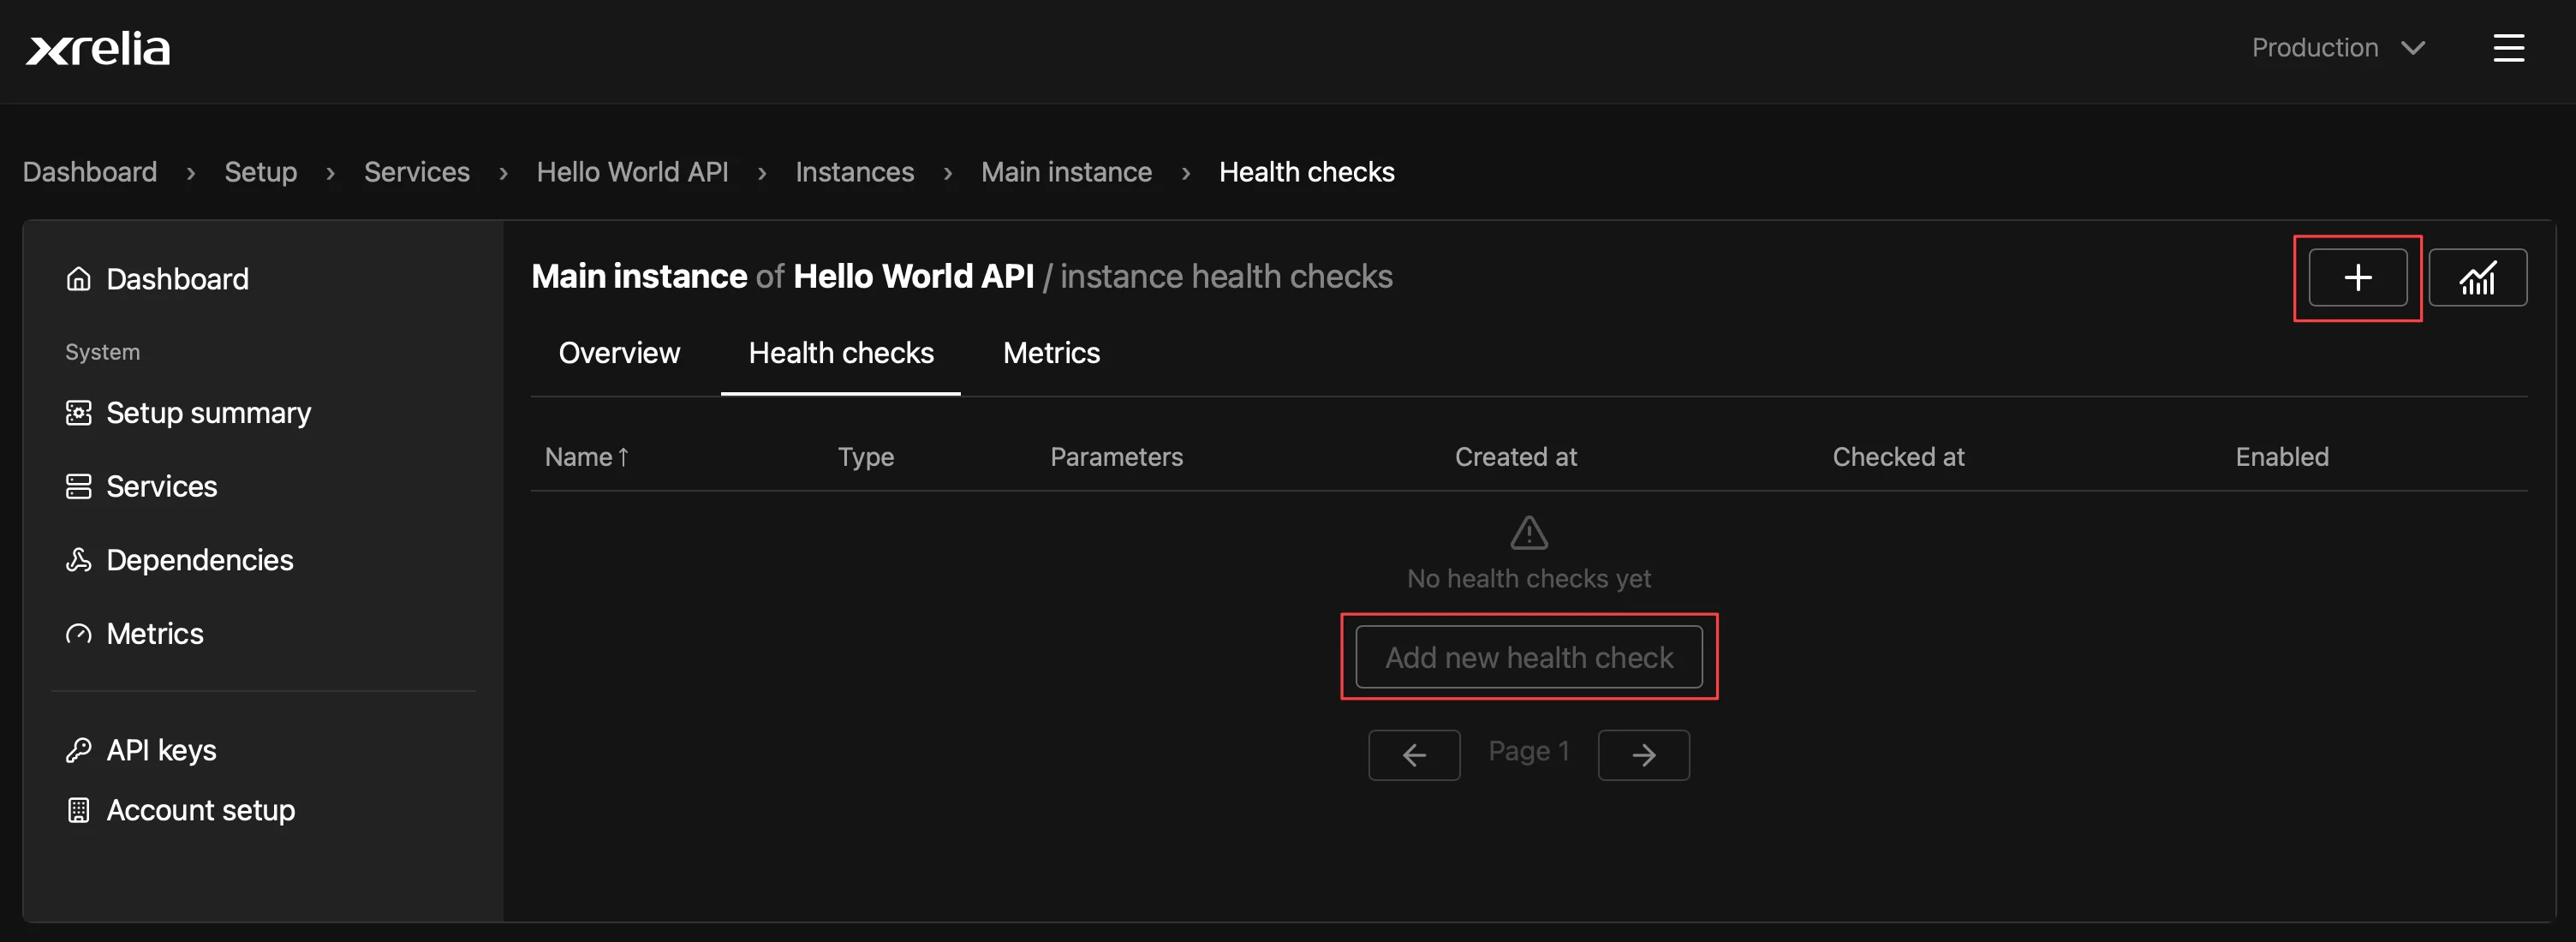
For this example, we’ll monitor a simple status endpoint.
Enter a health check name, choose HTTP as the health check type, select HEAD as the HTTP method, and enter the status endpoint URL.
You can also configure additional options such as authentication, request payloads, headers, timeouts, and response validation.
## Enable the Healtch check
[Section titled “Enable the Healtch check”](#enable-the-healtch-check)
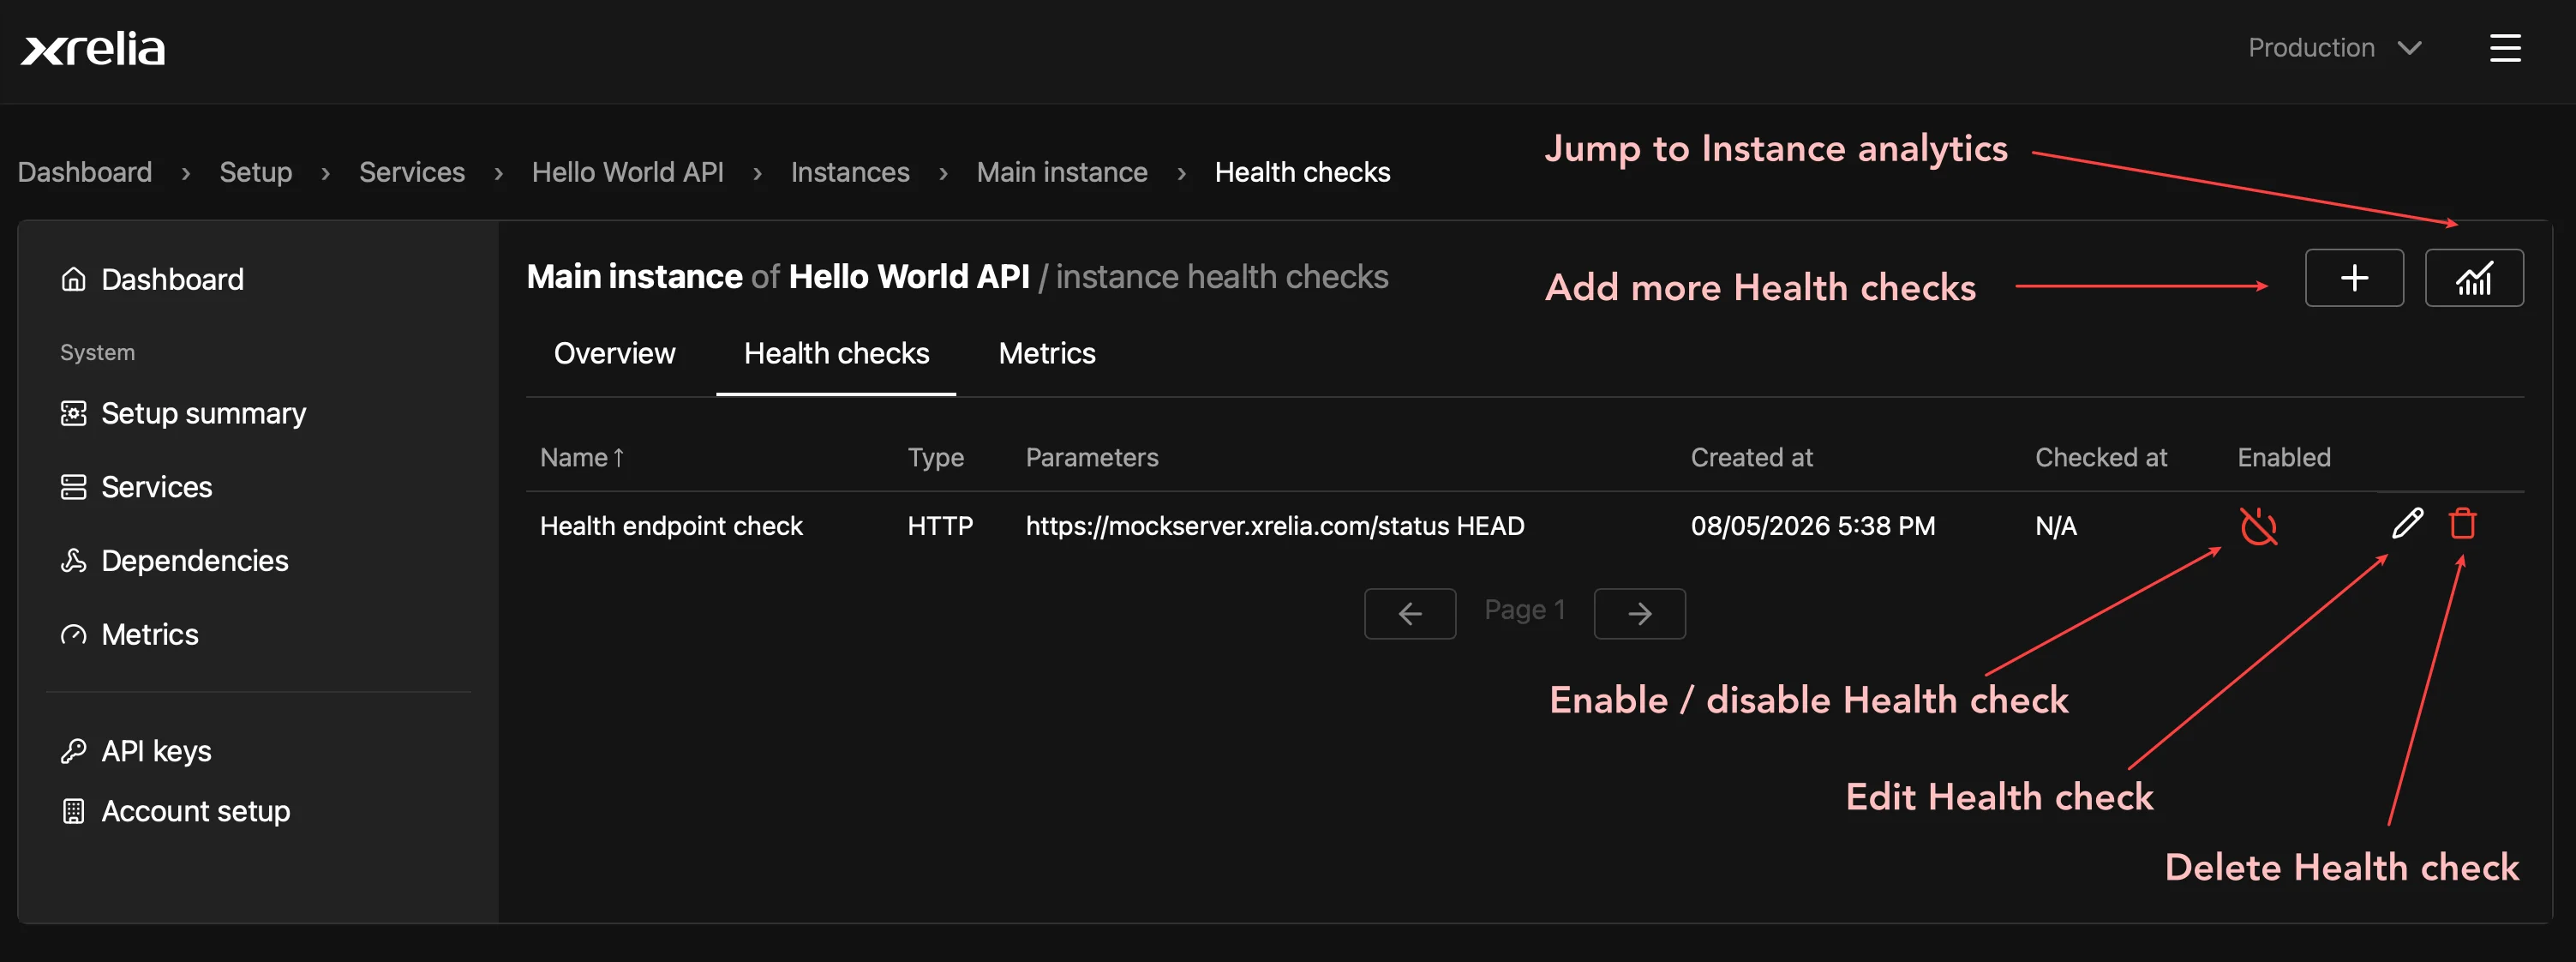
New health checks are created in a disabled state. Select the power icon to enable the health check.
From the Health checks tab, you can also edit, delete, or create additional health checks.
## Verify that it is running
[Section titled “Verify that it is running”](#verify-that-it-is-running)
After the health check is enabled, its status indicator will turn green once a successful check is completed.
The Checked at column shows the time of the most recent health check execution.
# Setup your first service
> Configure DocKit's global settings, theme options, and site-wide preferences.
This guide walks you through creating your first service and adding a service instance.
## Open the System setup page
[Section titled “Open the System setup page”](#open-the-system-setup-page)
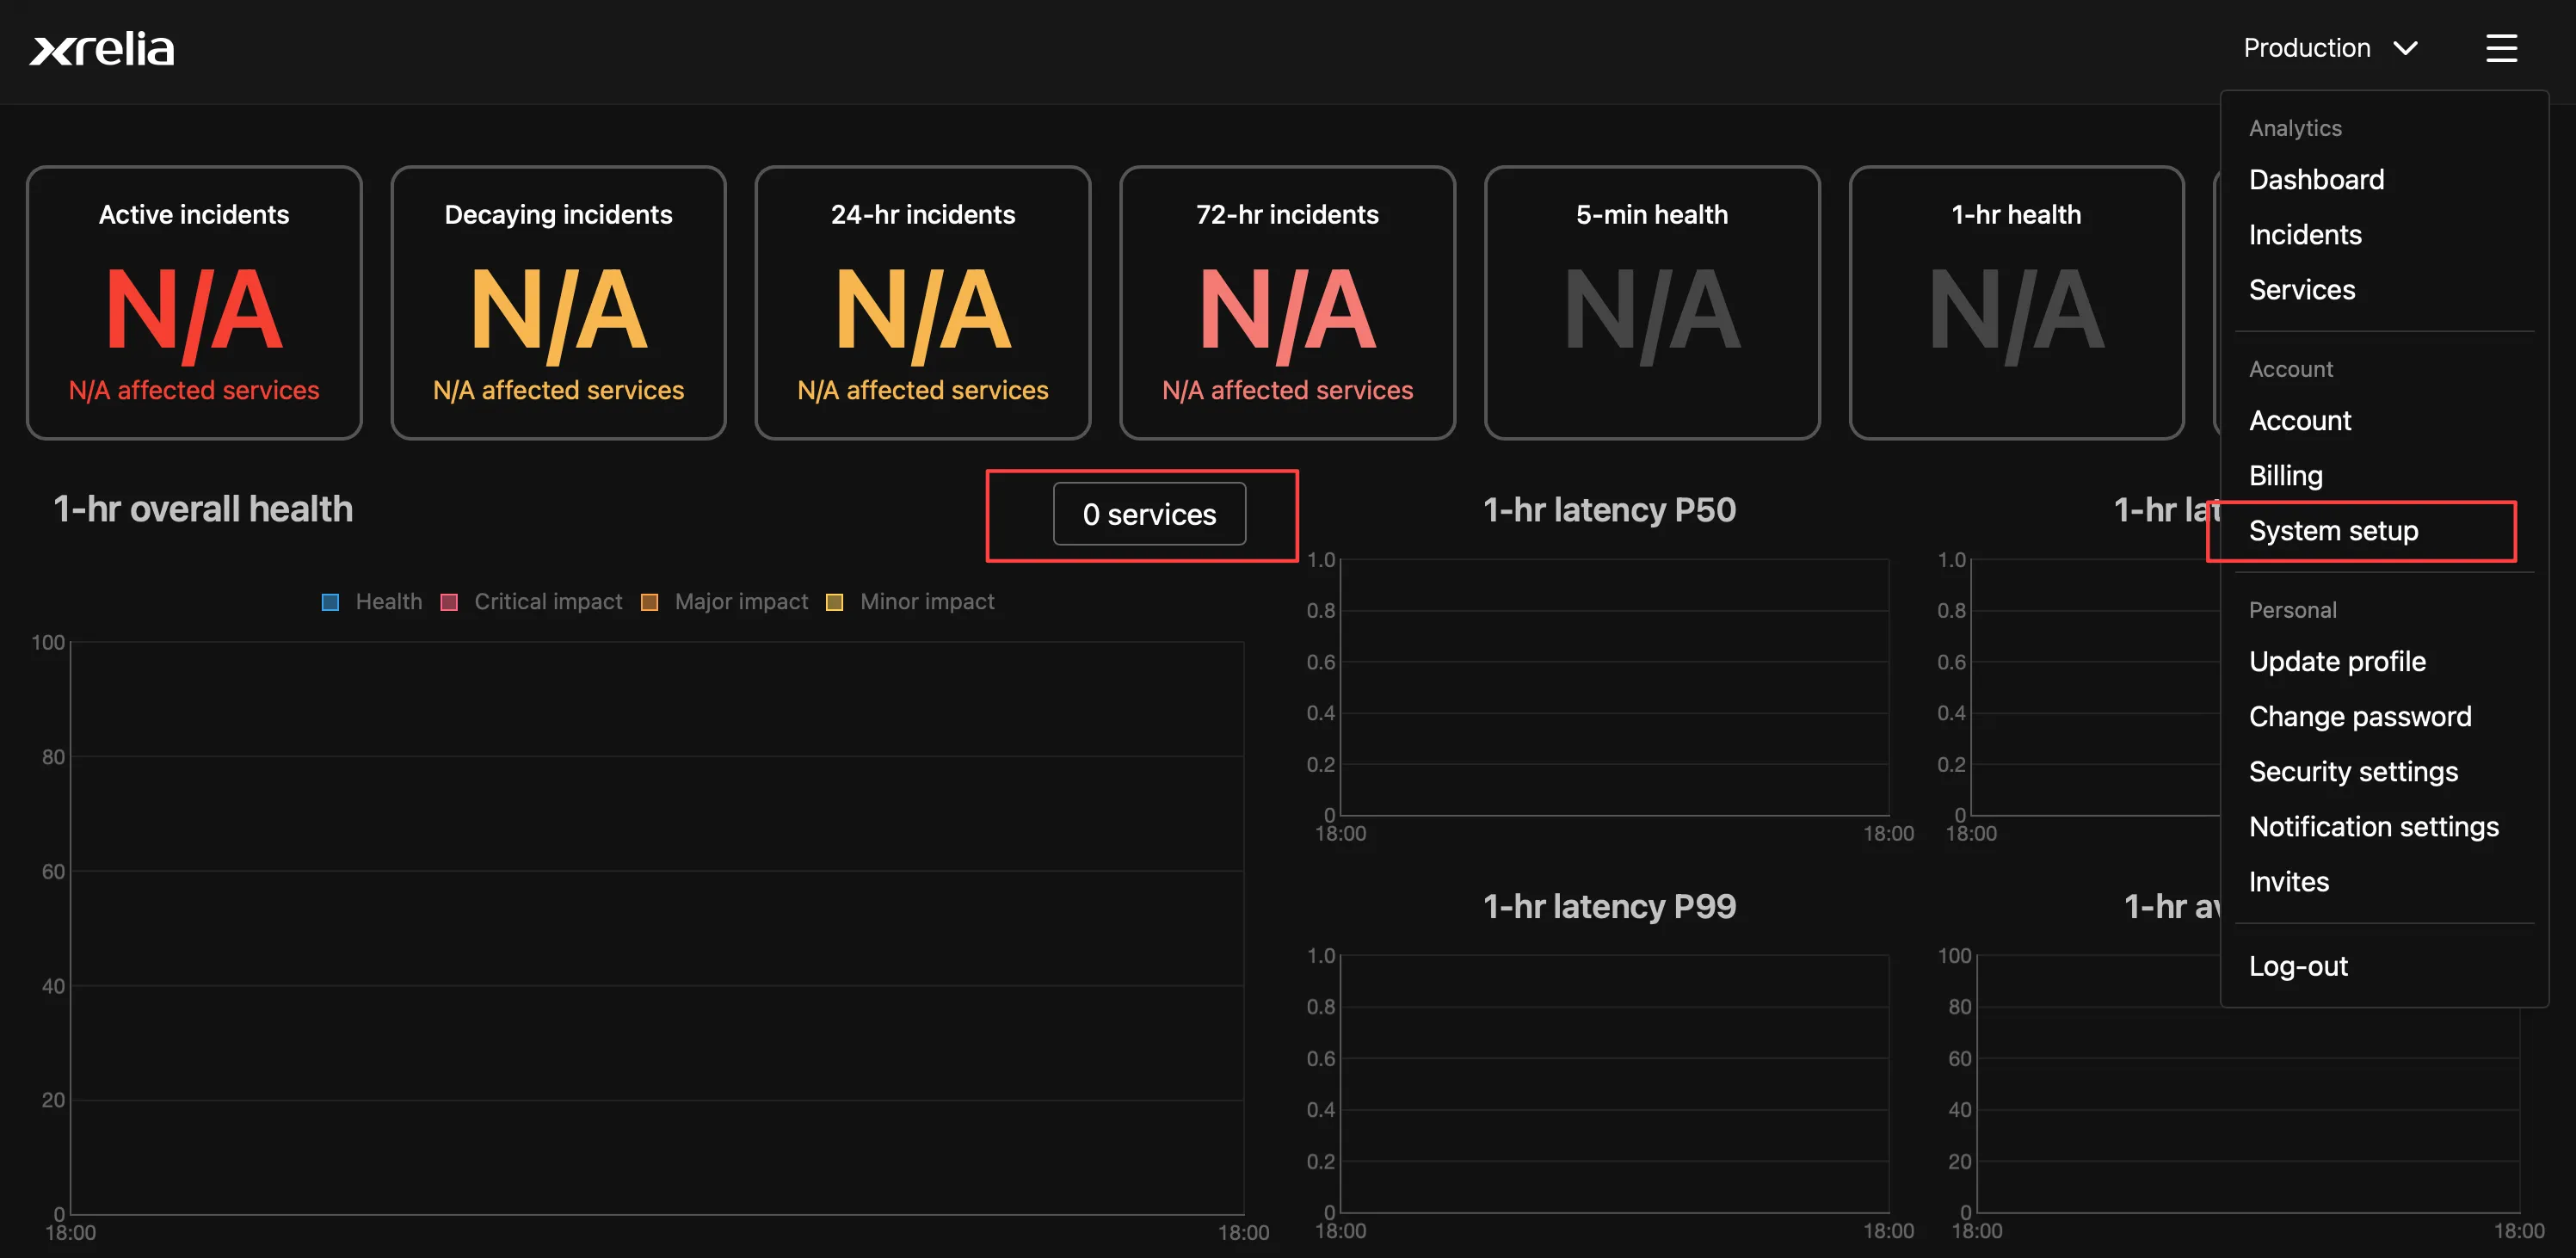
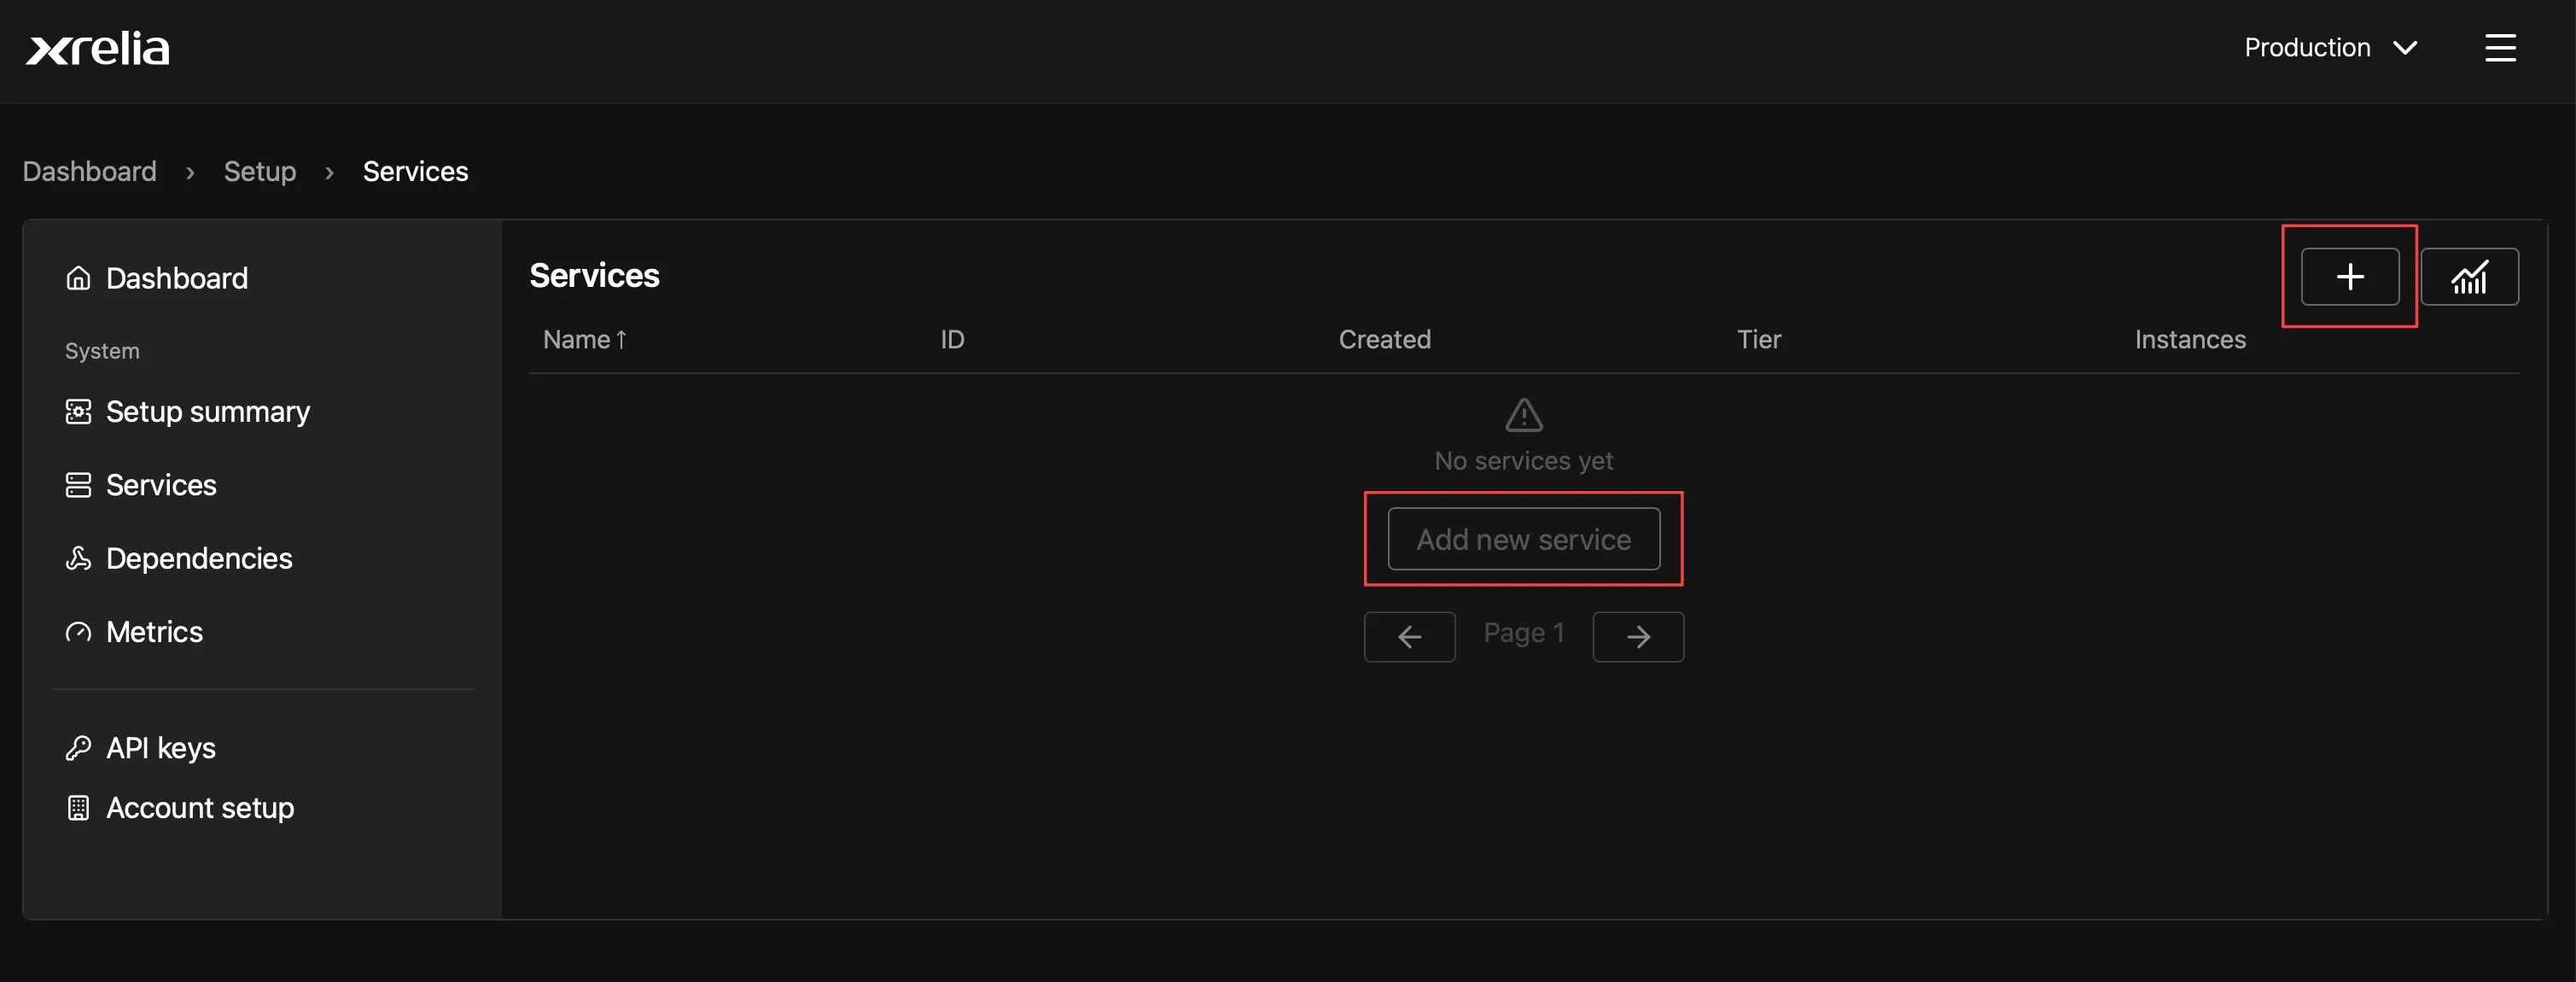
Open [System setup](https://console.xrelia.com/setup) from the main menu, then select Services from the sidebar. You can also jump directly to the Services page from the service dropdown menu.
## Access the Services page
[Section titled “Access the Services page”](#access-the-services-page)
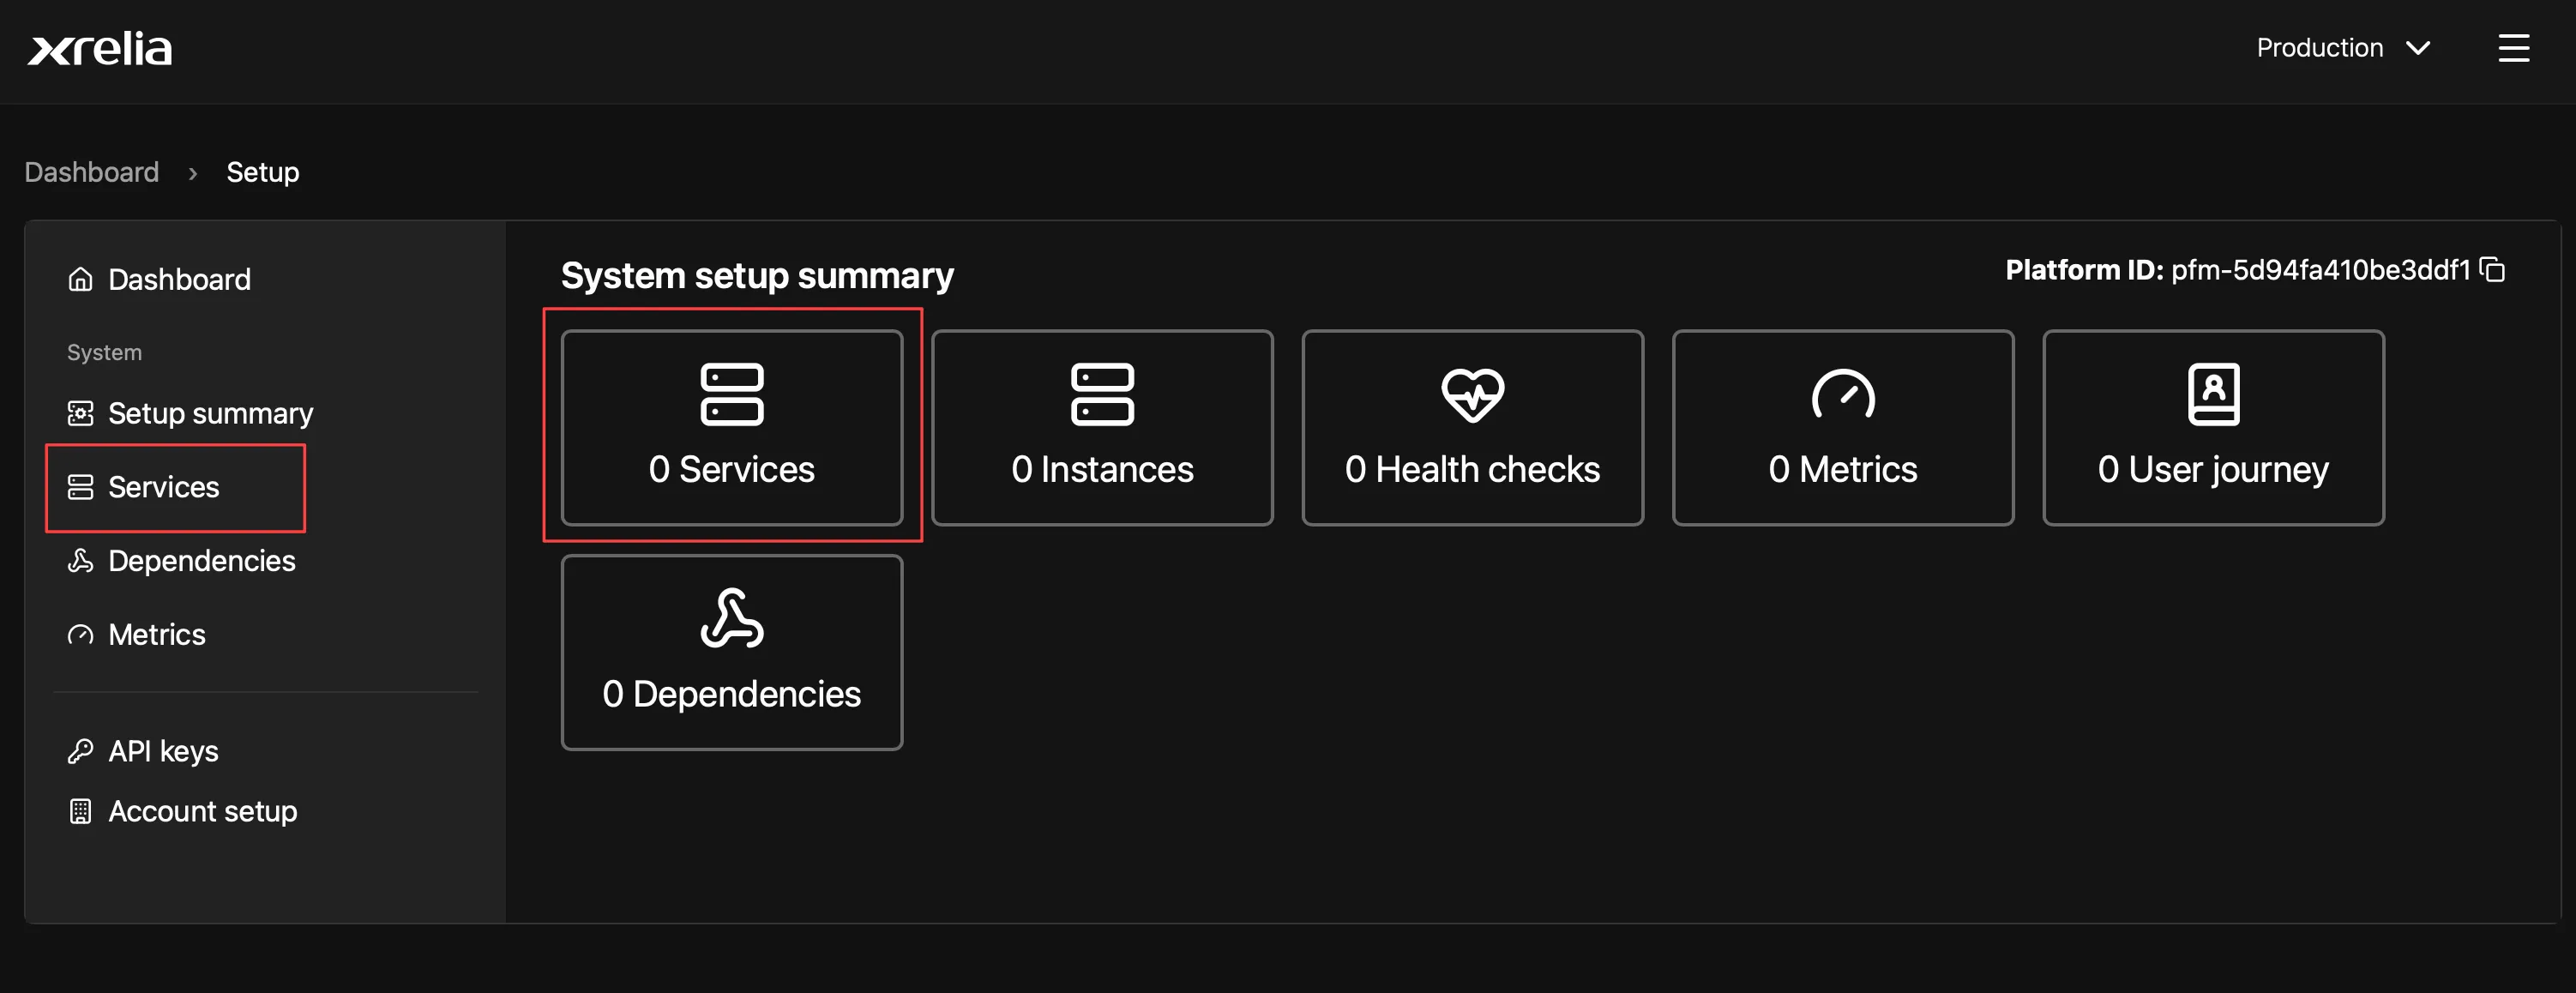
Select Services from the side menu or use the **Services** tile.
## Add Service
[Section titled “Add Service”](#add-service)
Select the **+** button or the **Add new service** button
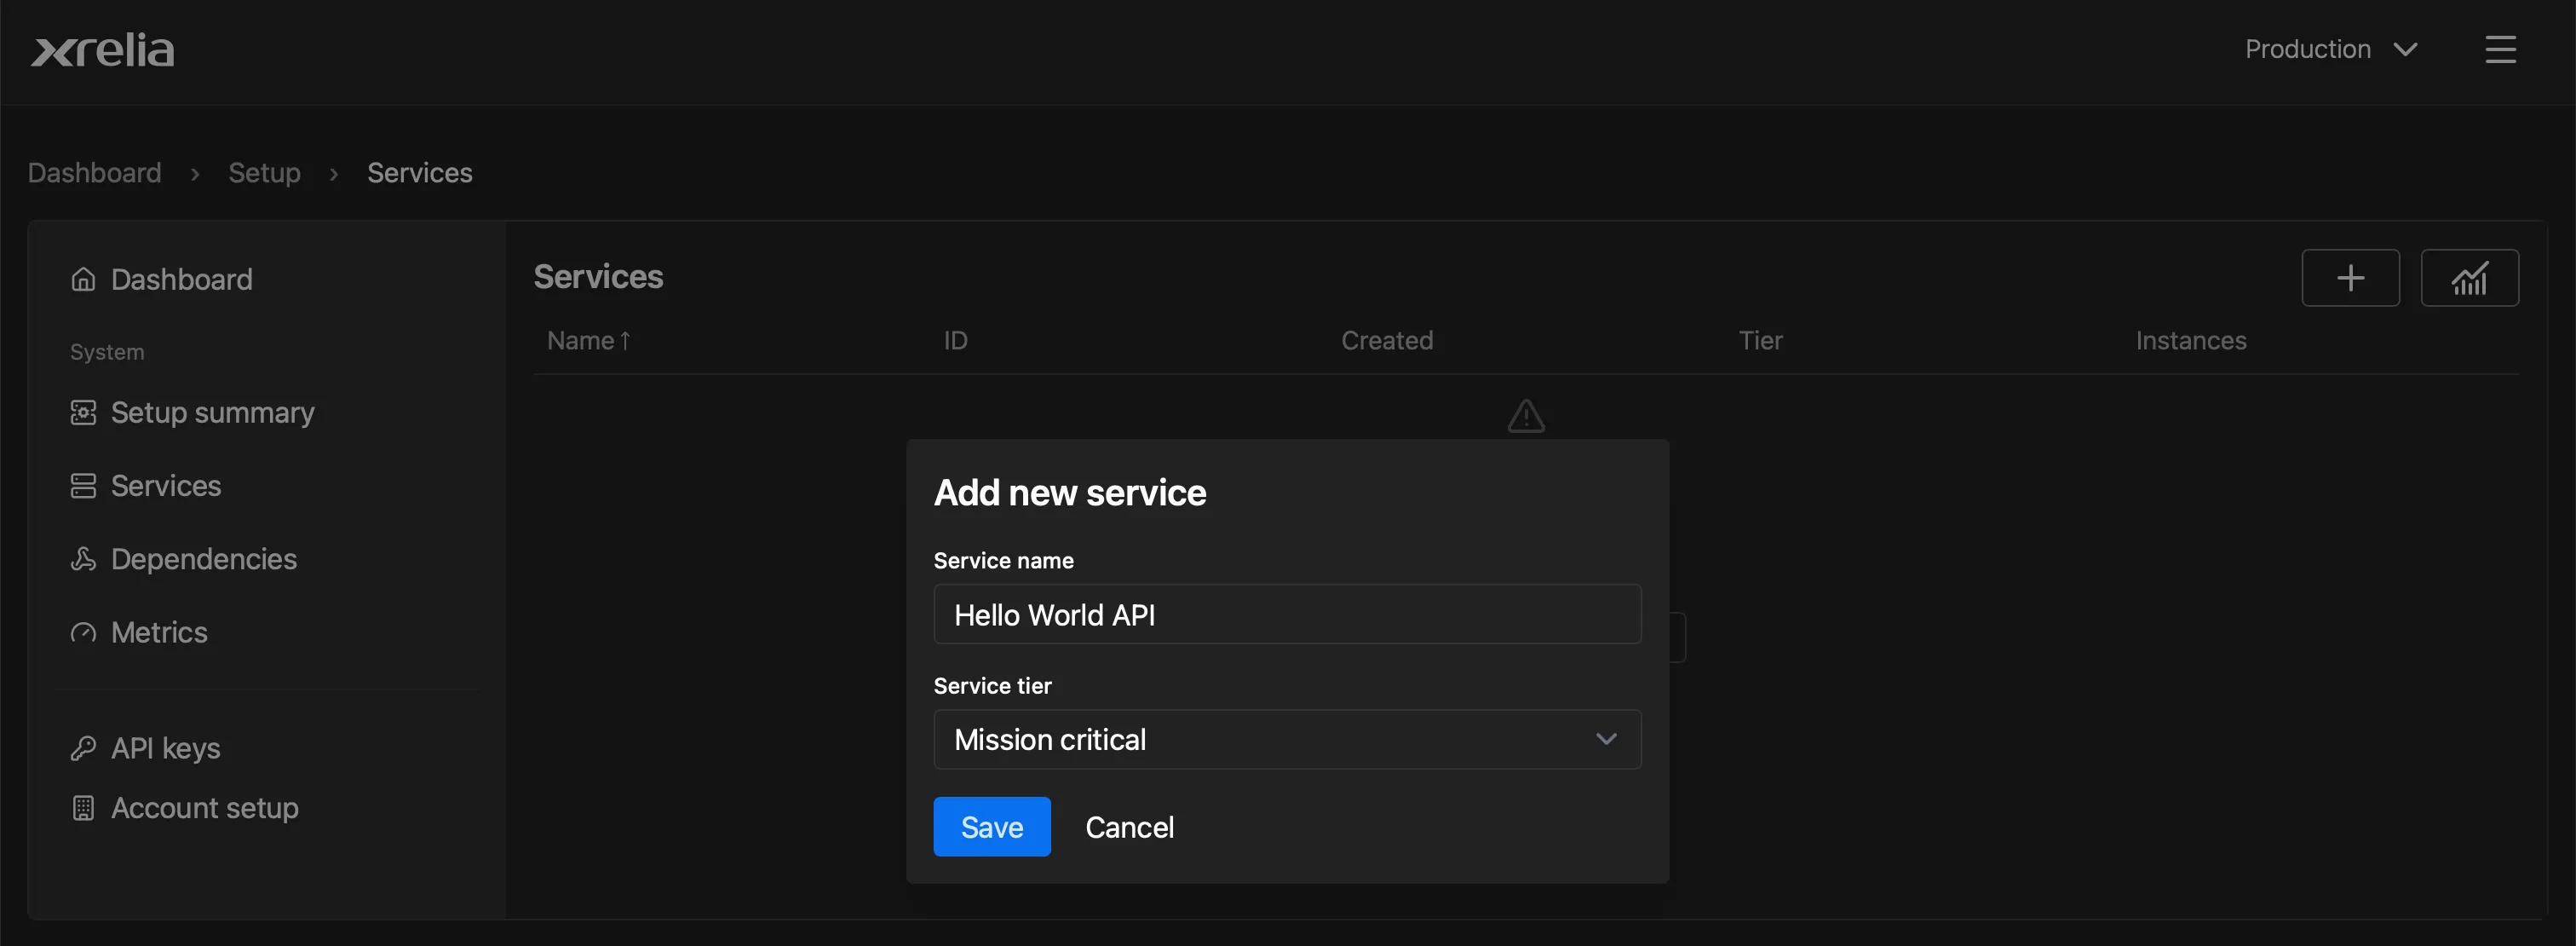
Enter a service name and choose a service tier, then save the service.
## Service overview page
[Section titled “Service overview page”](#service-overview-page)
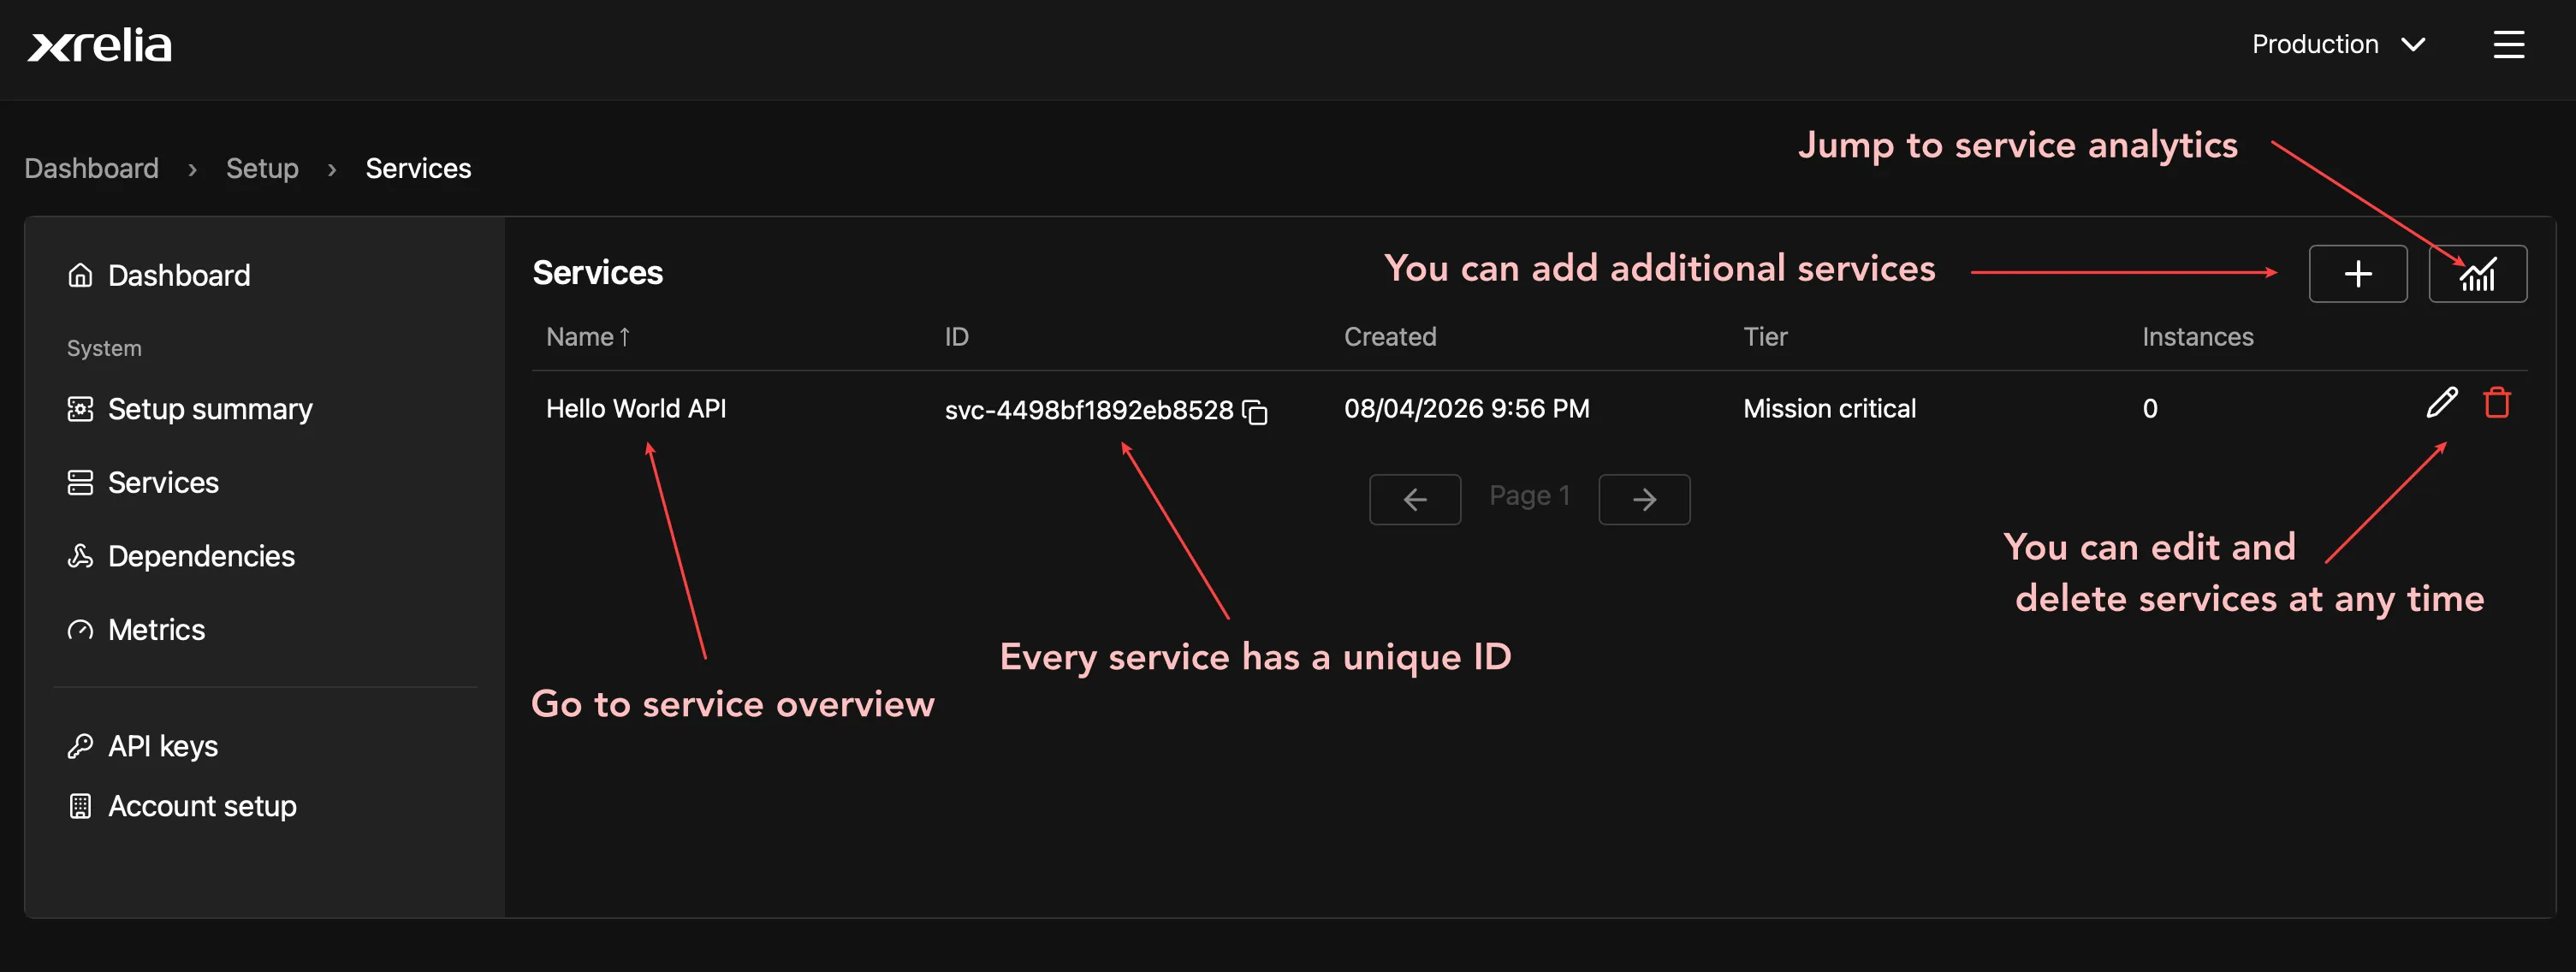
Your first service has now been created.
From the Services page, you can edit or delete services, open service analytics, or view the Service overview page.
## Add a service instance
[Section titled “Add a service instance”](#add-a-service-instance)
Every service must have at least one service instance. A service can have multiple instances across different regions, environments, or infrastructure providers.
From service overview page switch to the **Instances** tab or select the instances tile.
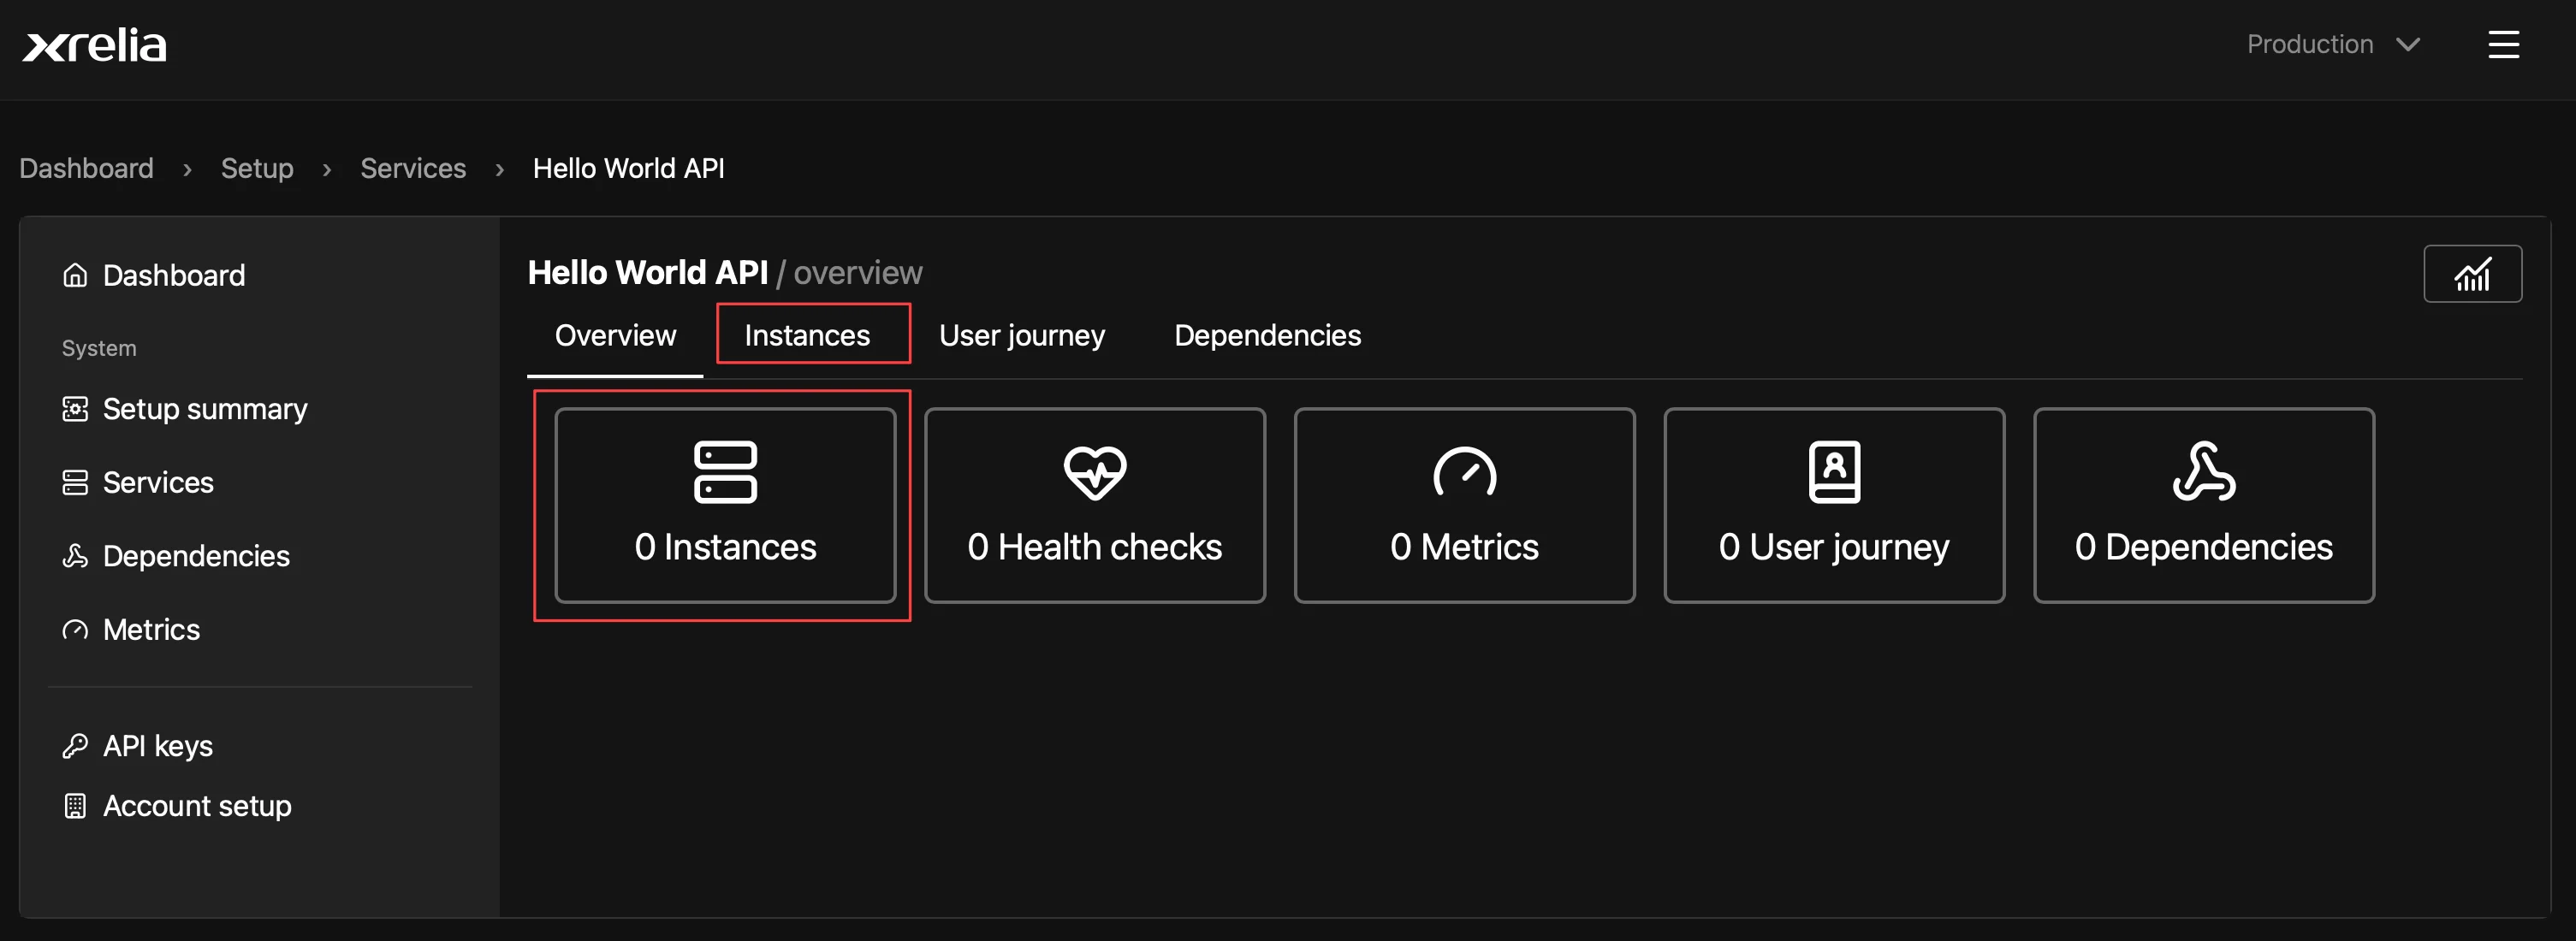
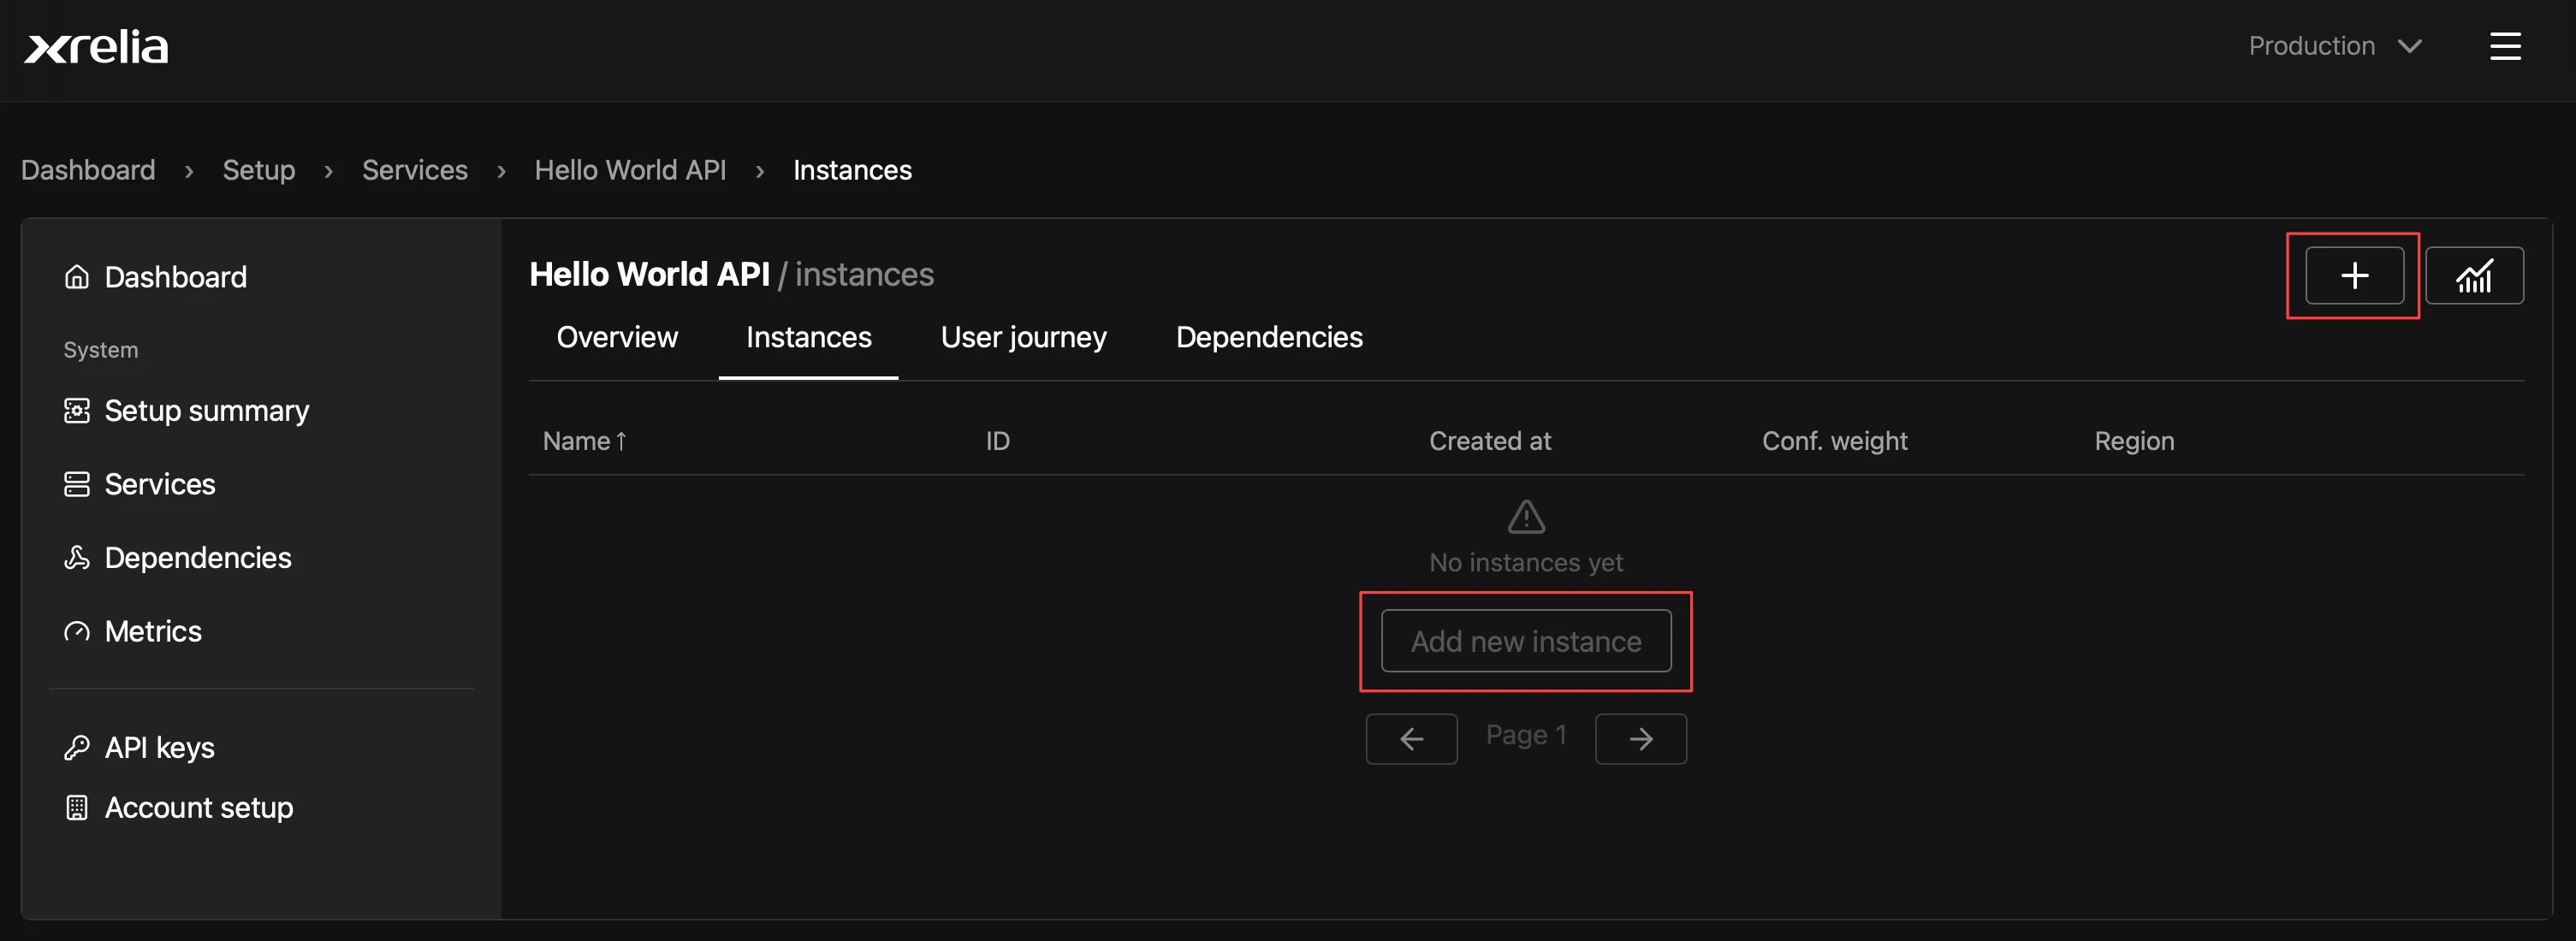
On the instances tab, select the **+** button or the **Add new instance** button.
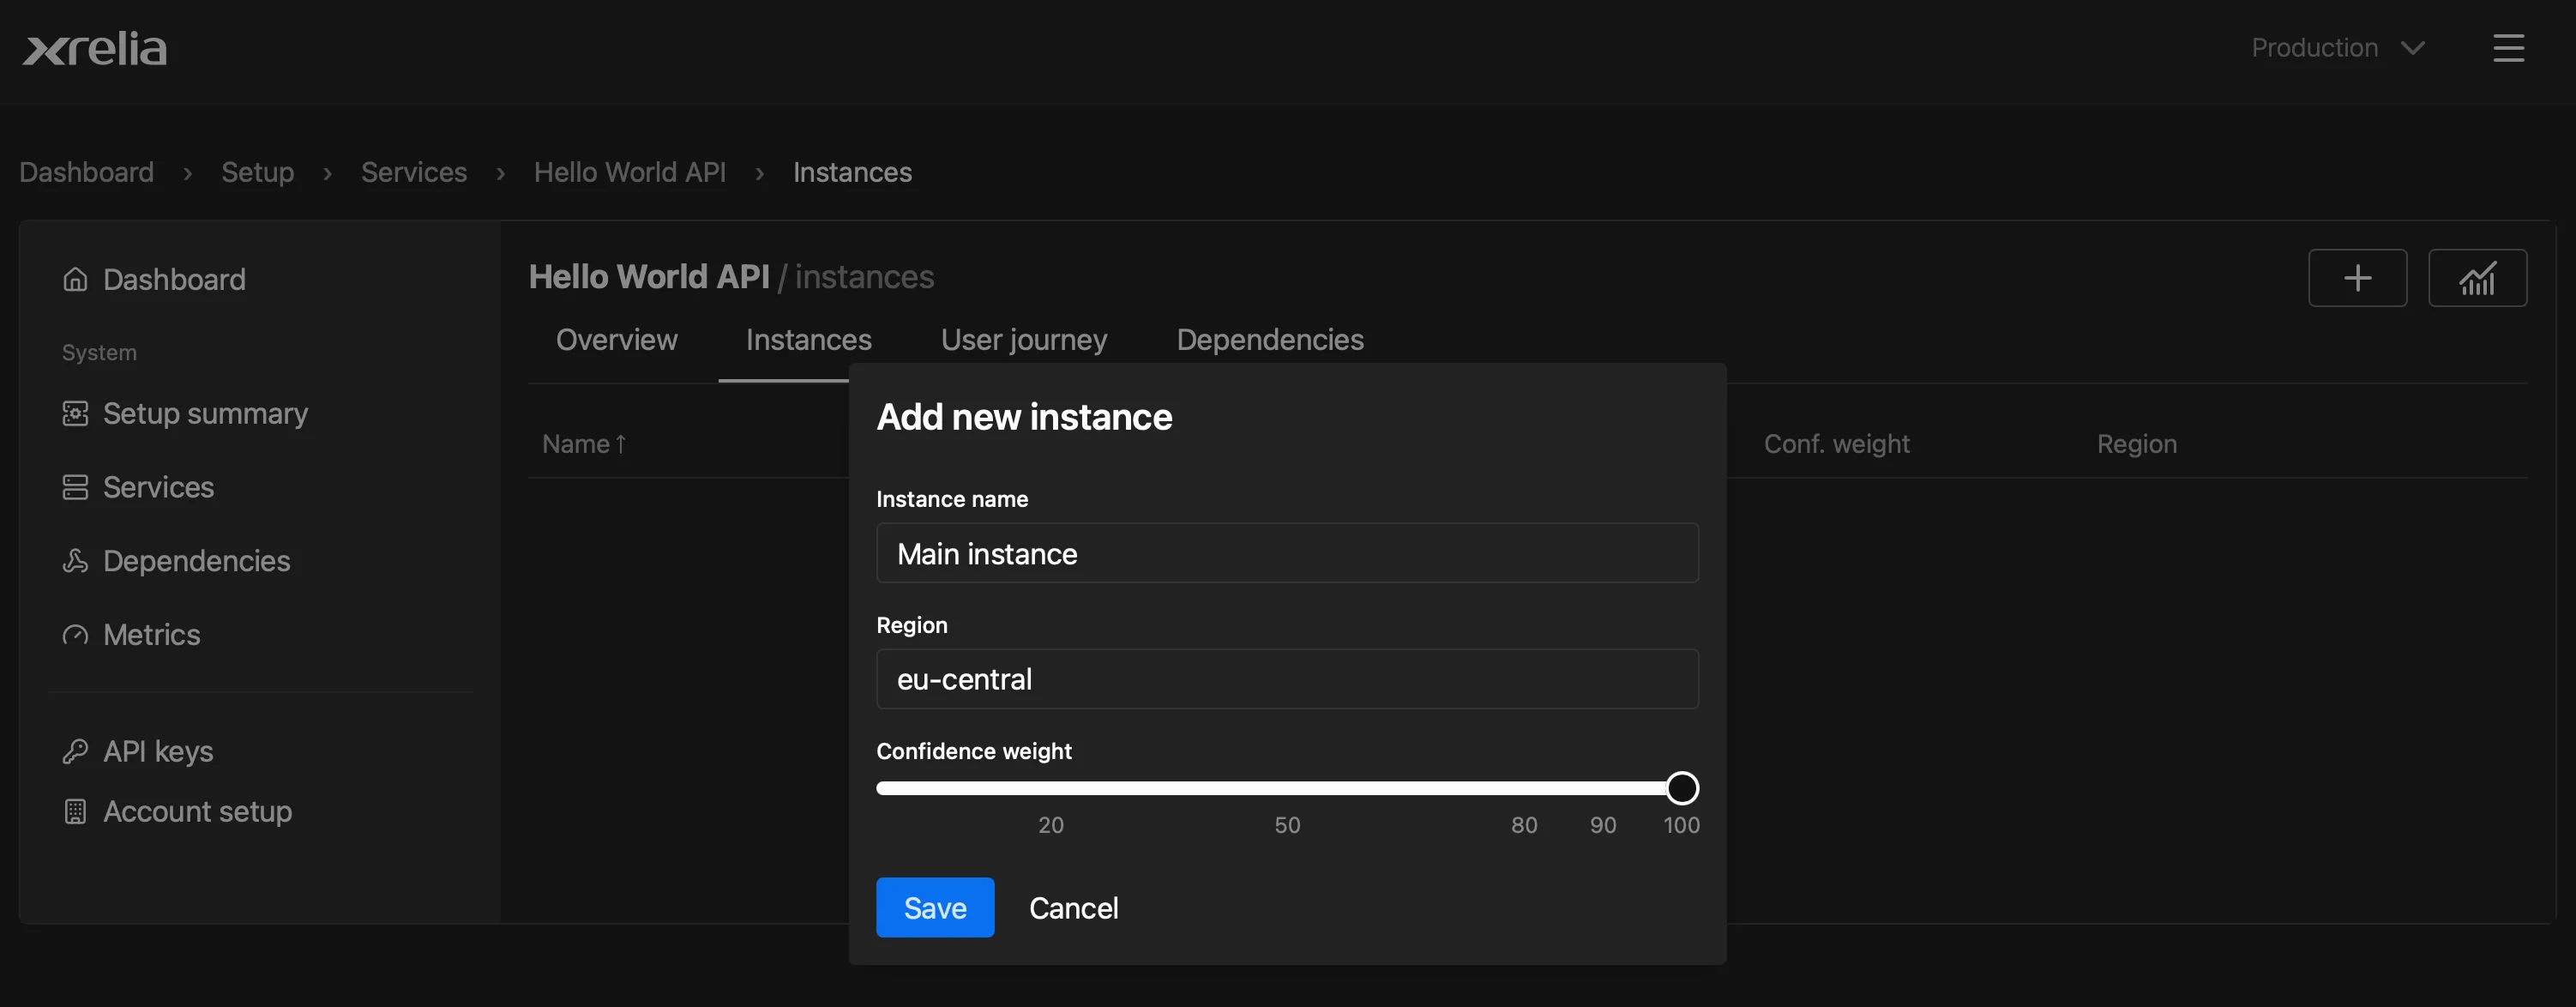
Enter an instance name, select a region, and set the confidence weight.
Confidence weight indicates how much trust xrelia should place in an instance when calculating overall service confidence.
Use 100 for a fully trusted production instance. Lower values (such as 80–90) are useful for instances that are less reliable, such as staging instances, older hardware, or regions with lower operational reliability.
In most cases, you should leave this value at 100.
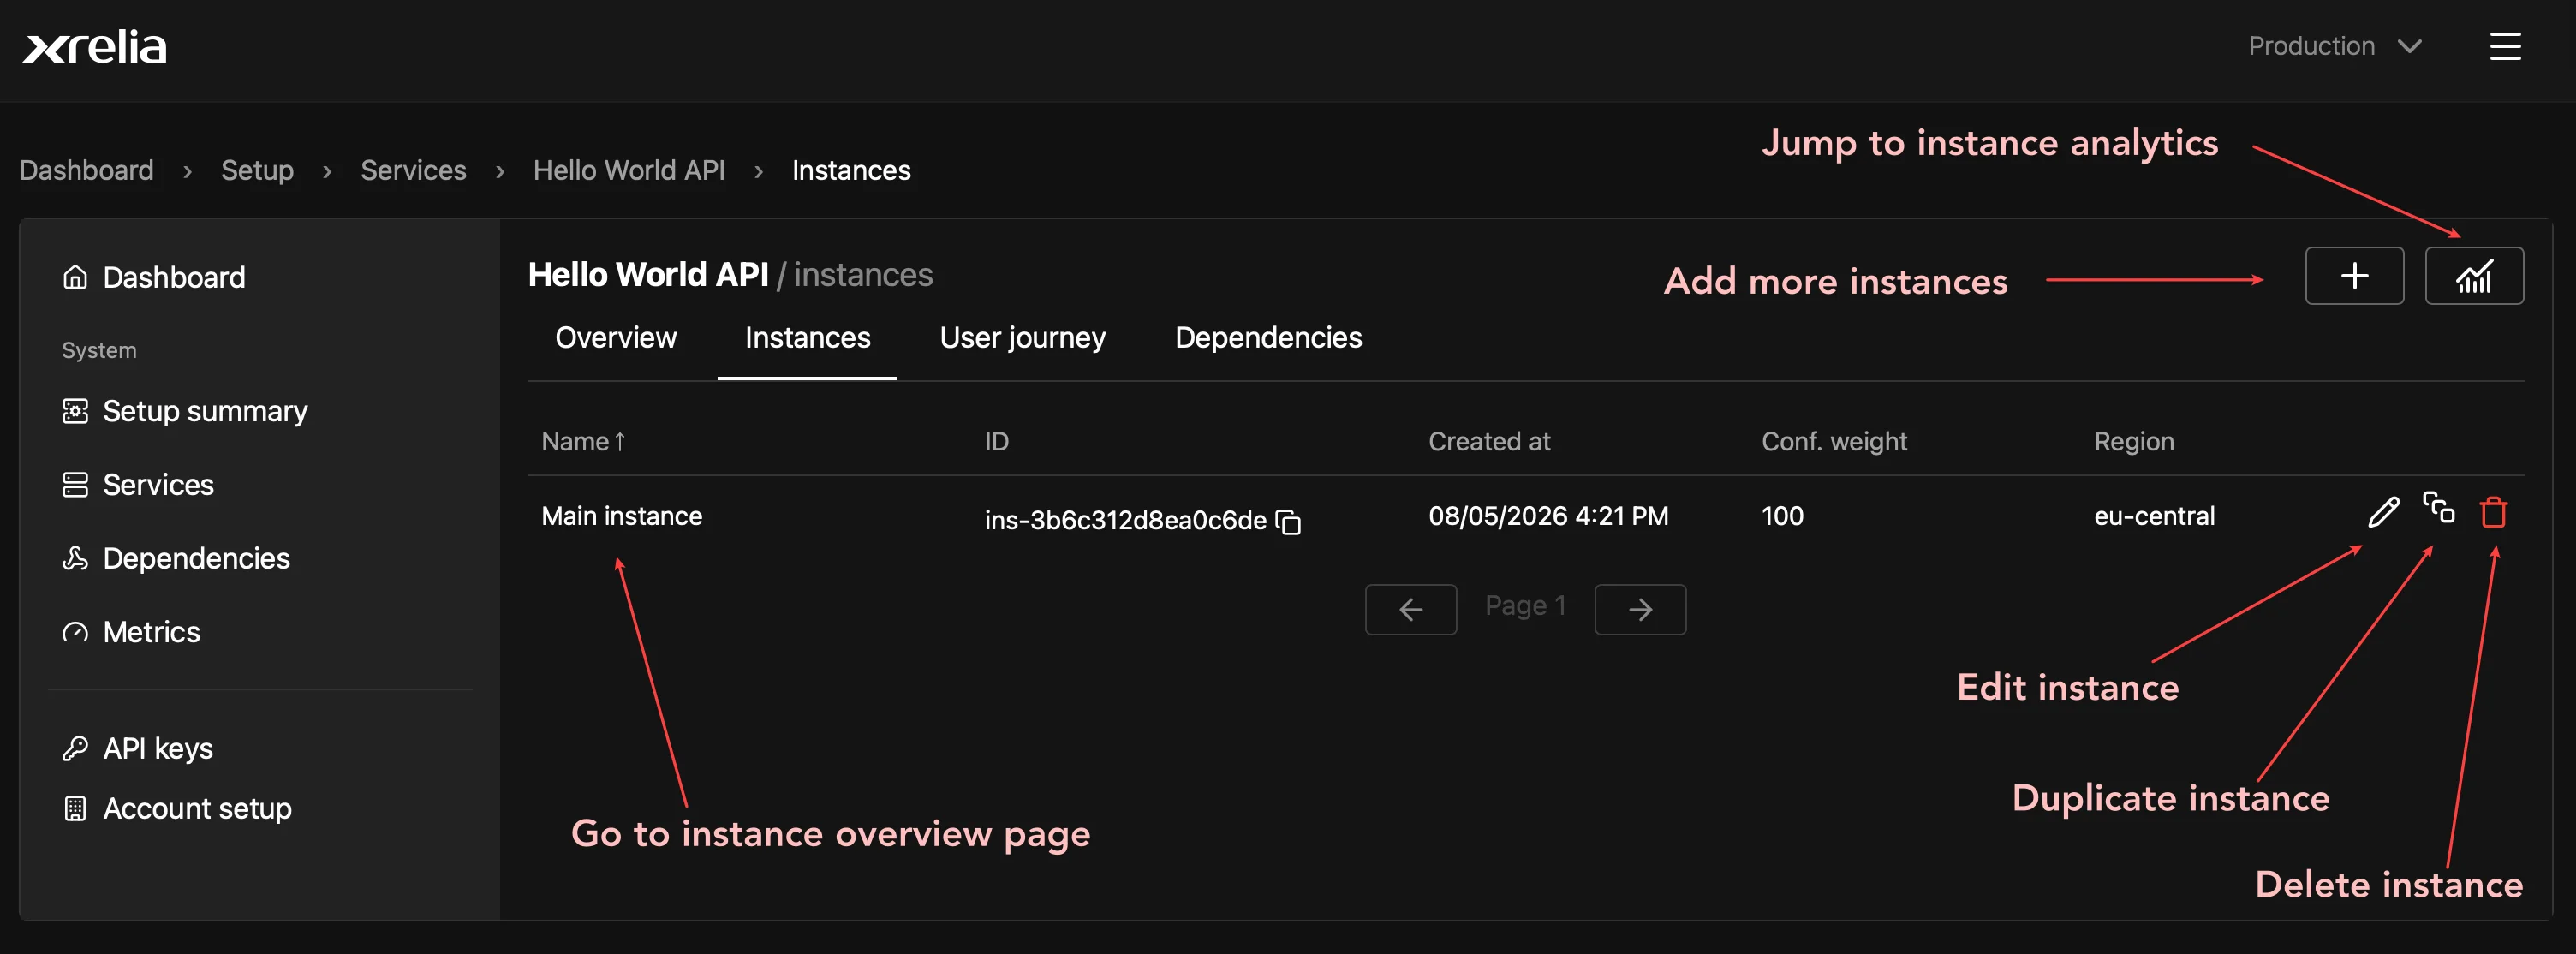
From the Instances tab, you can edit, duplicate, or delete instances, view instance analytics, or open the Instance overview page.
With your service and first instance in place, you’re ready to add your first health check.
# Trigger a test incident
> Configure DocKit's global settings, theme options, and site-wide preferences.
xrelia can send incident notifications through multiple notification channels, including email and push notifications. Each channel has its own minimum incident severity, allowing you to control which incidents are delivered through each notification method. For example, you might receive all incidents by email, but only high or extreme severity incidents as push notifications.
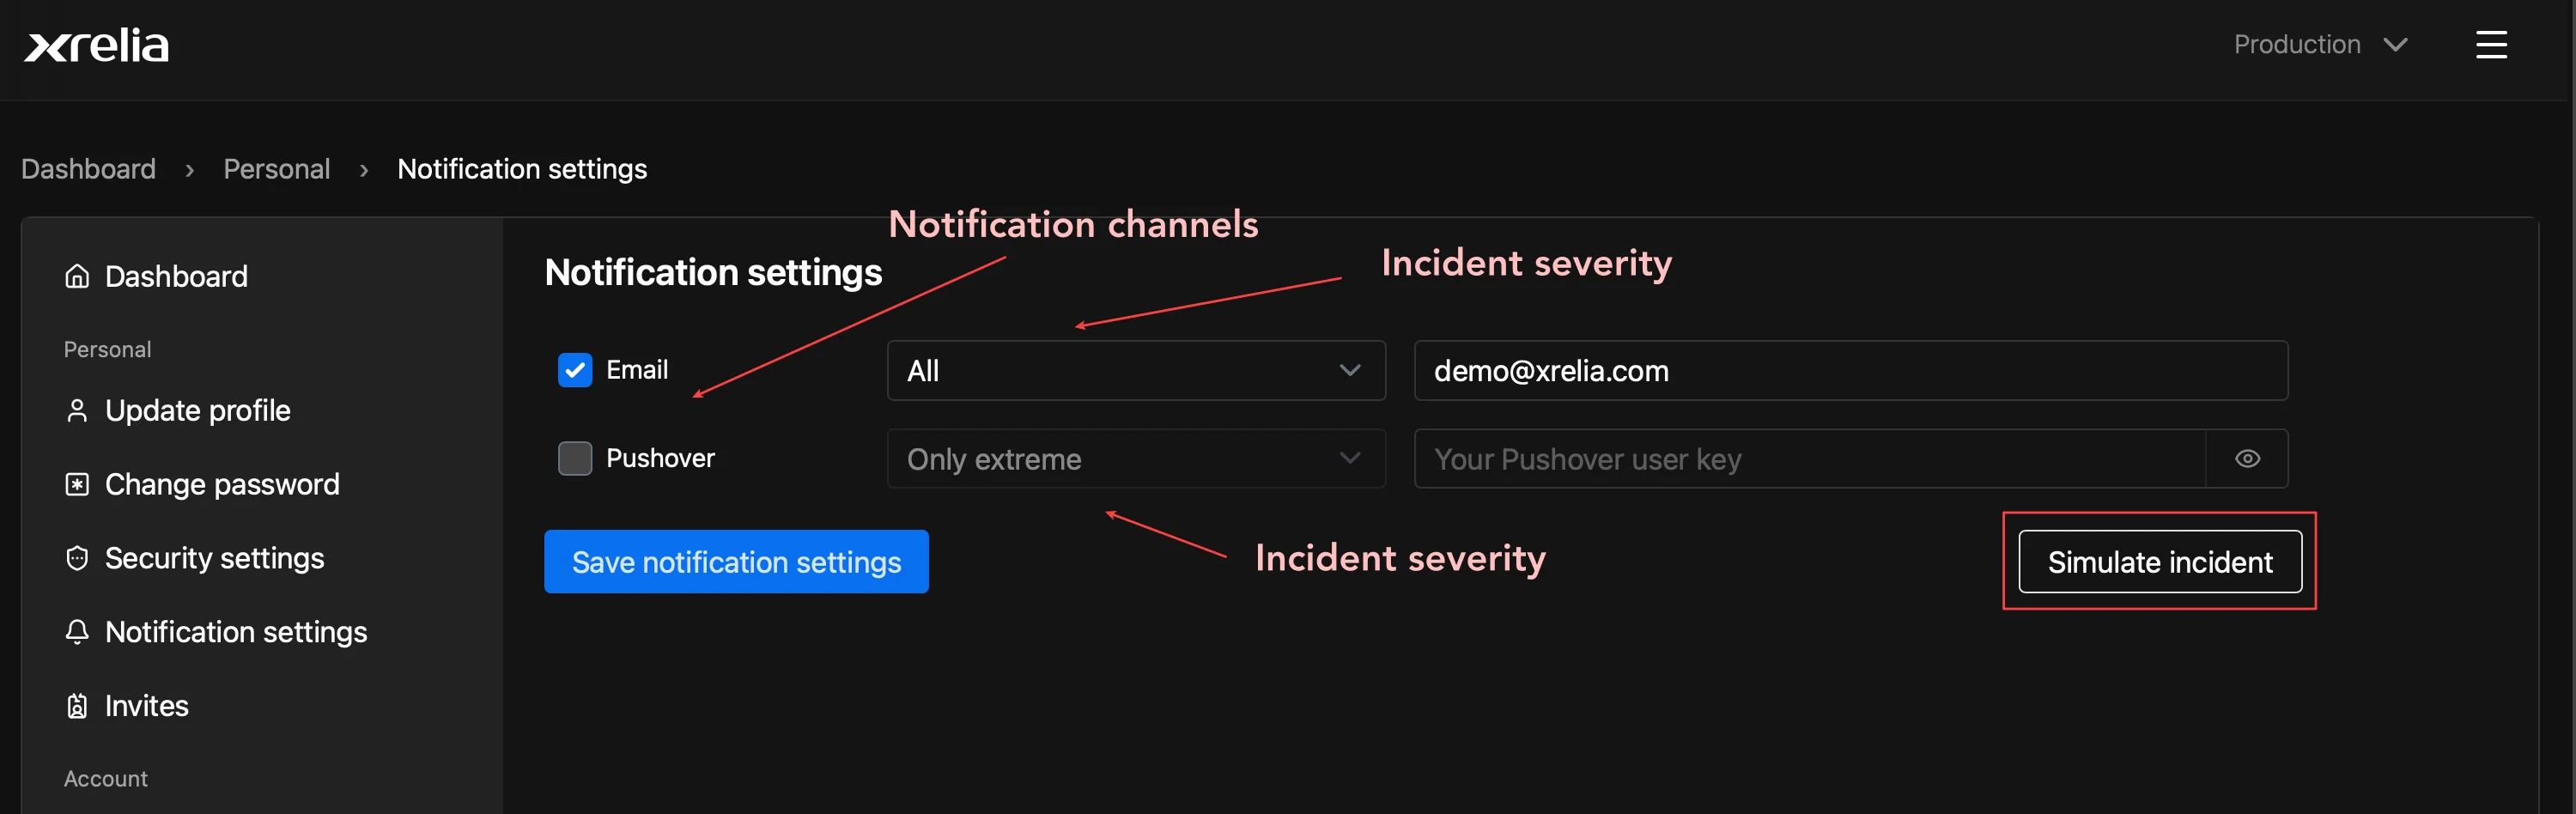
Open [Notification settings](https://console.xrelia.com/personal/notification-settings) page and select **Simulate incident** to trigger a test incident.
Use this to verify that your notification channels are configured correctly and that you receive incident notifications as expected.
## You’re all set
[Section titled “You’re all set”](#youre-all-set)
Congratulations! You’ve created your first service, added a service instance, configured a health check, and verified incident notifications
Your service is now being monitored by xrelia.
# API client
> An overview of all the configuration options Starlight supports.
The xrelia API can be accessed directly over HTTP, but for most applications we recommend using one of the official xrelia API clients. The API client handles authentication, request formatting, payload validation, and communication with the xrelia API, allowing you to focus on collecting and sending reliability data.
Currently, official API clients are available for:
Go JavaScript Python
Additional language support will be added over time.
### Authentication
[Section titled “Authentication”](#authentication)
All API clients use the same authentication mechanism.
Before creating a client, export your API key as the XRELIA\_API\_KEY environment variable.
`export XRELIA_API_KEY=""`
The client automatically reads the API key from the environment and generates the required authentication headers for every request.
### Sending metric samples
[Section titled “Sending metric samples”](#sending-metric-samples)
Metric samples allow you to push custom application, infrastructure, or business metrics into xrelia.
The following example sends two metric samples for the same metric.
push\_metrics.go
```go
metrics := protocol.NewMetrics()
metrics.AddSample(protocol.MetricSample{
ID: "CPU_METRIC_ID",
Val: 25.5,
TS: time.Now().Unix(),
})
metrics.AddSample(protocol.MetricSample{
ID: "CPU_METRIC_ID",
Val: 27.8,
})
if err := client.SendMetrics(
"PLATFORM_ID",
"INSTANCE_ID",
metrics,
); err != nil {
logger.Error(err.Error())
}
```
Metric samples are automatically batched and submitted to the xrelia metrics API.
### Sending synthetic request results
[Section titled “Sending synthetic request results”](#sending-synthetic-request-results)
Synthetic requests allow you to track the health of critical user journeys and application workflows.
Examples include:
* User login
* Checkout process
* Account registration
* Payment processing
* API transactions
The following example submits two synthetic request results.
push\_user\_journey.go
```go
userJourney := protocol.NewUserJourney()
userJourney.AddSyntheticRequestResult(protocol.SyntheticRequestResult{
ID: "LOGIN_REQUEST_ID",
TS: time.Now().Unix(),
Status: 0,
})
userJourney.AddSyntheticRequestResult(protocol.SyntheticRequestResult{
ID: "LOGIN_REQUEST_ID",
TS: time.Now().Unix(),
Status: 100,
})
if err := client.SendUserJourney(
"PLATFORM_ID",
"INSTANCE_ID",
userJourney,
); err != nil {
logger.Error(err.Error())
}
```
Each synthetic request result records the outcome of a monitored user action and contributes to the overall health and confidence score of the associated service.
### Platform and Instance IDs
[Section titled “Platform and Instance IDs”](#platform-and-instance-ids)
All API operations require:
* platformId
* instanceId
These identifiers determine where incoming data is stored and analyzed within xrelia.
You can find both values in the xrelia Console on the Service Instance overview page.
### Additional Data Types
[Section titled “Additional Data Types”](#additional-data-types)
In addition to metrics and synthetic requests, the API clients also support:
* Dependency health reporting
* Deployment tracking
* Configuration change tracking
These capabilities allow xrelia to correlate operational events with service health and provide richer reliability insights.
Refer to the language-specific SDK documentation for complete examples and API reference information.
# SDK and instrumentation overview
> An overview of all the configuration options Starlight supports.
#
xrelia provides two ways to connect your applications and infrastructure to the platform: the **xrelia API** and the **xrelia agent**.
Use the API when you want to send custom data directly from your applications, services, or automation workflows. Use the agent when you want to automatically collect infrastructure metrics, service health and user journey information with minimal configuration.
Together, these tools give you the flexibility to monitor everything that matters—from application-level events to infrastructure performance.
## xrelia API
[Section titled “xrelia API”](#xrelia-api)
The xrelia API allows you to send data directly to the platform from your applications and services.
Use the API to:
* Report custom metrics
* Send application events
* Create deployments and configuration changes
* Push health status updates
* Push synthetic request status update
* Integrate xrelia with your internal tools and automation
The API is ideal when you need fine-grained instrumentation or want to integrate xrelia into your existing engineering workflows.
## xrelia agent
[Section titled “xrelia agent”](#xrelia-agent)
The xrelia agent is a lightweight monitoring agent that automatically collects data from your infrastructure and running services.
Use the agent to:
* Collect CPU, memory, disk, and network metrics
* Monitor host and service health
* Gather system-level performance data
* Reduce manual instrumentation effort
* Connect servers and virtual machines to xrelia
* Send synthetic request check updates to xrelia
The agent is designed for quick deployment and low operational overhead, making it the fastest way to start monitoring infrastructure with xrelia.
## Choosing the right approach
[Section titled “Choosing the right approach”](#choosing-the-right-approach)
In most environments, teams use **both** the API and the agent.
* **agent** for infrastructure visibility, system metrics and synthetic requests
* **API** for application-specific telemetry, deployments, and custom events
This combination gives xrelia a complete view of your production environment and enables more accurate reliability analysis, incident detection, and service confidence scoring.
# Configuration
> An overview of all the configuration options Starlight supports.
After installing the agent, two configuration steps are required:
1. Configure the xrelia API key
2. Configure the agent settings file
***
## Configuring the API key
[Section titled “Configuring the API key”](#configuring-the-api-key)
The agent authenticates using the same API client used by custom integrations.
Before starting the agent, export your API key as the `XRELIA_API_KEY` environment variable:
```bash
export XRELIA_API_KEY=""
```
The agent automatically reads this value and uses it to authenticate all requests sent to xrelia.
For production deployments, we recommend configuring the environment variable through your systemd service configuration or environment management solution.
***
## Configuring the agent
[Section titled “Configuring the agent”](#configuring-the-agent)
The agent configuration file determines:
* Which platform and instance receive incoming data
* Which metrics are collected
* Whether synthetic request reporting is enabled
* How collected data maps to xrelia resources
The configuration requires both a `platformId` and an `instanceId`, which can be obtained from the xrelia Console.
Individual metric collectors can be enabled or disabled independently.
When a metric collector is enabled, the corresponding metric ID from the xrelia console must also be provided. See the [System setup section](/docs/console-guide/system-setup/metrics) in the Console guide.
Example configuration:
```json
{
"platformId": "PLATFORM_ID",
"instanceId": "INSTANCE_ID",
"userJourney": {
"enabled": false
},
"metrics": {
"cpu": {
"enabled": true,
"metricId": "CPU_METRIC_ID"
},
"ram": {
"enabled": false,
"metricId": "RAM_METRIC_ID"
},
"load": {
"enabled": false,
"metricId": "LOAD_METRIC_ID"
},
"net": {
"enabled": false,
"iface": "en0",
"metricId": "NETWORK_METRIC_ID"
}
}
}
```
***
## Supported metrics
[Section titled “Supported metrics”](#supported-metrics)
The agent currently supports the following built-in system metrics:
* CPU utilization
* Memory utilization
* System load
* Network throughput
Each metric can be enabled or disabled independently through the configuration file.
This allows you to collect only the metrics relevant to your environment while maintaining complete control over what data is sent to xrelia.
***
## User Journey monitoring
[Section titled “User Journey monitoring”](#user-journey-monitoring)
The agent can also report synthetic request and user journey results.
Unlike system metrics, user journey monitoring requires additional scripting and integration with your applications or automation workflows.
This functionality is covered in the [next section](/docs/sdk-and-instrumentation/xrelia-agent/user-journey) of the documentation.
***
# Next steps
[Section titled “Next steps”](#next-steps)
After installing and configuring the agent:
* Enable synthetic request monitoring
* Verify incoming data in the xrelia console
The agent will begin sending data to xrelia as soon as it is started and successfully authenticated.
# Installing the agent
> An overview of all the configuration options Starlight supports.
xrelia provides pre-built installers for Linux distributions.
Download the latest release package from the xrelia GitHub repository:
```text
xrelia-agent_1.0.8_amd64.deb
```
Install the package using your preferred package manager:
```bash
sudo dpkg -i xrelia-agent_1.0.8_amd64.deb
```
The installer automatically:
* Installs the xrelia agent binary
* Creates the required configuration directories
* Registers the agent as a systemd service
* Configures the service to start automatically
After installation, the service can be managed using standard systemd commands:
```bash
sudo systemctl start xrelia
sudo systemctl stop xrelia
sudo systemctl restart xrelia
sudo systemctl status xrelia
```
***
## Building from source
[Section titled “Building from source”](#building-from-source)
The xrelia agent is fully open source and available on GitHub.
If you prefer, you can build the agent yourself and deploy it using your own packaging or service management approach.
The GitHub repository contains:
* Source code
* Build instructions
* Release notes
* Contribution guidelines
# Overview
> An overview of all the configuration options Starlight supports.
The xrelia agent provides a simple way to collect system metrics and user journey results and automatically send them to xrelia. It runs as a lightweight background service and integrates directly with the xrelia API.
The agent is written in Go, designed for minimal resource consumption, and is fully open source.
Use the agent to:
* Collect CPU, memory, disk, and network metrics
* Monitor host and service health
* Gather system-level performance data
* Reduce manual instrumentation effort
* Connect servers and virtual machines to xrelia
* Send synthetic request check updates to xrelia
* The agent is designed for quick deployment and low operational overhead, making it the fastest way to start monitoring infrastructure with xrelia.
# User journey
> An overview of all the configuration options Starlight supports.
The xrelia agent provides a lightweight scripting engine for implementing synthetic requests and user journey monitoring. Instead of configuring individual checks through a UI, you can write JavaScript that performs real application workflows, validates responses, and reports the results back to xrelia.
This approach makes it easy to monitor complex user journeys such as authentication, checkout, payment processing, or any other sequence of HTTP requests.
## How it works
[Section titled “How it works”](#how-it-works)
The xrelia agent acts as the runtime engine, while your synthetic request logic lives in one or more JavaScript files.
The agent automatically discovers and executes scripts from a directory named `scripts`.
The agent pushes synthetic request results to xrelia via the API.
On a standard Linux installation, the scripts directory is:
```text
/opt/xrelia/scripts
```
You can organize your synthetic requests across multiple JavaScript files in any way that is convenient for your project. A single file can perform one synthetic request or an entire user journey involving multiple dependent requests.
## JavaScript runtime
[Section titled “JavaScript runtime”](#javascript-runtime)
The current version of the xrelia agent supports **full ECMAScript 5.1**.
The runtime is capable of executing JavaScript compiled to ES5, including output generated by Babel, the TypeScript compiler, and similar transpilation tools.
Future versions may add support for additional scripting languages such as Python or Lua.
## Supported protocols
[Section titled “Supported protocols”](#supported-protocols)
The current agent supports **HTTP and HTTPS requests**.
Synthetic request scripts can invoke REST APIs, web applications, and other HTTP-based services.
## The scripting API
[Section titled “The scripting API”](#the-scripting-api)
The xrelia agent exposes three functions to every script:
* `xStart`
* `xFinish`
* `xFail`
These functions provide a simple lifecycle for executing and reporting synthetic requests.
### xStart
[Section titled “xStart”](#xstart)
`xStart` initiates a synthetic request and performs the actual HTTP or HTTPS request.
It accepts the following arguments:
* Synthetic Request ID
* URL
* HTTP method
* Headers
* Request body
The Synthetic Request ID must match the corresponding synthetic request configured in the xrelia console.
Example:
```javascript
const res = xStart(
"SYNTHETIC_REQUEST_ID",
"https://api.example.com/login",
"post",
headers,
payload
);
```
The function returns a response object with the following properties:
* `Request`
* `StatusCode`
* `Body`
`StatusCode` contains the HTTP response status code.
`Body` contains the parsed response body returned by the server.
The `Request` object is the object that will eventually be reported back to xrelia.
### xFinish
[Section titled “xFinish”](#xfinish)
After examining the response, your script must set the request status and call `xFinish`.
The status is stored in `Request.Status`.
Use:
* `100` for success
* `0` for failure
Example:
```javascript
res.Request.Status = res.StatusCode === 200 ? 100 : 0;
xFinish(res.Request);
```
### xFail
[Section titled “xFail”](#xfail)
`xFail` immediately marks a synthetic request as failed without executing it.
This is useful for dependent requests.
For example, if authentication fails, subsequent requests that require a valid session token should be reported as failed immediately rather than attempting to execute them.
Example:
```javascript
xFail("DASHBOARD_REQUEST_ID");
xFail("PROFILE_REQUEST_ID");
```
## Example: Authentication user journey
[Section titled “Example: Authentication user journey”](#example-authentication-user-journey)
The following script performs a login request, validates the response, reports the result to xrelia, and captures a session token for subsequent requests.
```javascript
const BASE_URL = "https://api.example.com";
const headers = {
"content-type": "application/json"
};
// Login synthetic request
const resAuth = xStart(
"SYNTHETIC_REQUEST_ID",
BASE_URL + "/authenticate",
"post",
headers,
{
emailAddress: "me@example.com",
password: "mypassword"
}
);
resAuth.Request.Status =
!resAuth.Body || resAuth.StatusCode === 200 ? 100 : 0;
xFinish(resAuth.Request);
if (resAuth.Request.Status > 0) {
headers["x-session-token"] = resAuth.Body.sessionToken;
// Additional synthetic requests can be executed here
} else {
// Dependent synthetic requests cannot proceed
xFail("SYNTHETIC_REQUEST2_ID");
xFail("SYNTHETIC_REQUEST3_ID");
}
```
## Building complete user journeys
[Section titled “Building complete user journeys”](#building-complete-user-journeys)
The real power of the scripting engine is the ability to model complete user journeys.
A single script can:
* authenticate a user
* capture authentication tokens
* invoke multiple APIs
* validate response payloads
* measure the success of each step
* report every synthetic request independently
* handle dependency failures gracefully
This allows xrelia to monitor the same critical workflows that your customers use in production, providing a much more accurate picture of application health than isolated endpoint checks.
## Best practices
[Section titled “Best practices”](#best-practices)
For reliable synthetic monitoring, we recommend:
* keeping synthetic request IDs synchronized with the xrelia console
* checking both HTTP status codes and response content
* failing dependent requests explicitly with `xFail`
* organizing related workflows into separate script files
* avoiding unnecessary network calls
* using realistic request payloads and authentication flows
The scripting engine is designed to be simple, deterministic, and lightweight, making it suitable for running continuously as part of the xrelia agent.